


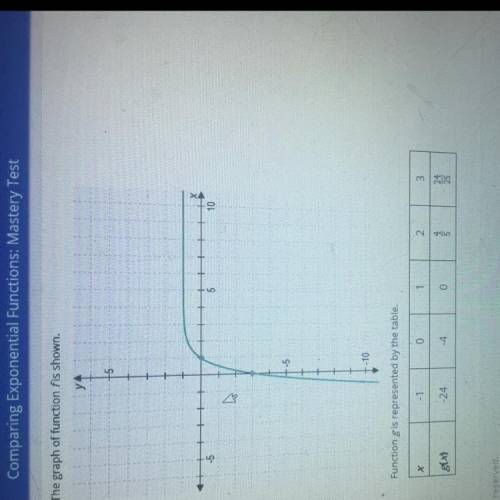
The graph of function fis shown.
Function g is represented by the table.
Which statement corr...

Mathematics, 12.06.2020 01:57, carolinasoto
The graph of function fis shown.
Function g is represented by the table.
Which statement correctly compares the two functions? A. They have the same y intercept and the same end behavior as x approaches infinity.
B. They have the same x intercept and the same end behavior as x approaches infinity?
C. They have the same x intercept and the same y intercept.
D. They have the same end behavior as x approaches infinity but they have different x and y intercepts.

Answers: 2
Other questions on the subject: Mathematics
Mathematics, 21.06.2019 15:30, ahoney2233
Iwill make brain if you me correctly fill this out needs due today pls and send it back to me (click the link and you will get it)
Answers: 2
Mathematics, 21.06.2019 21:00, noahdwilke
What is the unit rate of, 75% high fiber chimp food to 25% high protein chimp food.
Answers: 1
Mathematics, 21.06.2019 23:30, ashiteru123
The average daily maximum temperature for laura’s hometown can be modeled by the function f(x)=4.5sin(πx/6)+11.8 , where f(x) is the temperature in °c and x is the month. x = 0 corresponds to january. what is the average daily maximum temperature in may? round to the nearest tenth of a degree if needed. use 3.14 for π .
Answers: 1
Do you know the correct answer?
Questions in other subjects:


Physics, 16.04.2020 20:33

English, 16.04.2020 20:33

Mathematics, 16.04.2020 20:33
Mathematics, 16.04.2020 20:33


