

Mathematics, 11.06.2020 03:57, juuuuuu42
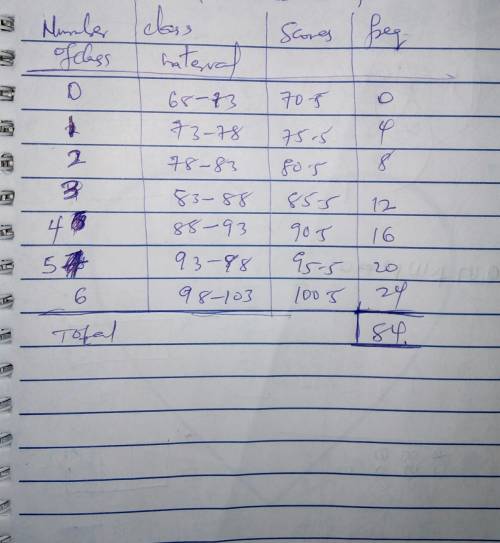
The following histogram shows the exam scores for a Prealgebra class. Use this histogram to answer the questions. Prealgebra Exam ScoresScores 70.5, 75.5, 80.5, 85.5, 90.5, 95.5, 100.5Frequency 0, 4, 8, 12, 16, 20, 24Step 1 of 5:Find the number of the class containing the largest number of exam scores (1, 2, 3, 4, 5, or 6).Step 2 of 5:Find the upper class limit of the third class. Step 3 of 5:Find the class width for this histogram. Step 4 of 5:Find the number of students that took this exam. Step 5 of 5:Find the percentage of students that scored higher than 95.595.5. Round your answer to the nearest percent.

Answers: 2


Other questions on the subject: Mathematics
Mathematics, 21.06.2019 15:50, tmarie03
Which formula finds the probability that a point on the grid below will be in the blue area? p(blue) = total number of squares number of blue squares number of blue squares p(blue) = total number of squares number of blue squares p(blue) = number of white squares
Answers: 1
Mathematics, 22.06.2019 01:30, Jadaflournoy5
Pls math have no ideamultiply and simppify. 2x^2y^3z^2 • 4xy^4x^2
Answers: 2
Mathematics, 22.06.2019 02:30, familyk0jj3
Graph the function =gx+2x3 and give its domain and range using interval notation.
Answers: 3
Do you know the correct answer?
The following histogram shows the exam scores for a Prealgebra class. Use this histogram to answer t...
Questions in other subjects:


