

Mathematics, 11.06.2020 01:57, lolz55678
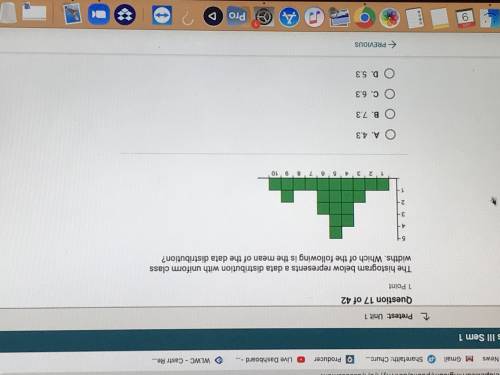
The histogram represents a data distribution with uniform class widths 1. Which of the following is the mean of the data distribution? A. 4.3
B. 7.3
C. 6.3
D. 5.3

Answers: 2


Other questions on the subject: Mathematics
Mathematics, 21.06.2019 19:30, sotoamerica0814
What is the effect on the graph of the function f(x)=x when f(x) is replaced with -f(x)+4
Answers: 1
Do you know the correct answer?
The histogram represents a data distribution with uniform class widths 1. Which of the following is...
Questions in other subjects:


