

Mathematics, 10.06.2020 19:57, alicemareus
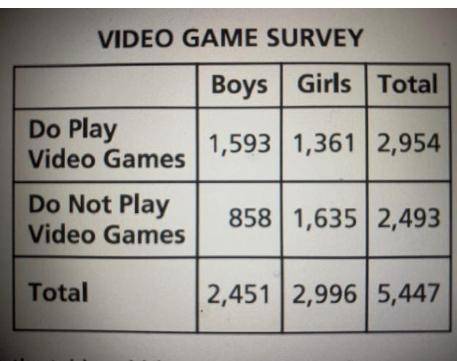
A newspaper conducted a survey to find out how many high school students play video games. The two-way table below displays the data from the survey. Based on these data in the table, which statement is true? *
A. There were 2,451 boys surveyed, and about 29% of them play video games.
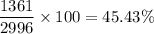
B. There were 2,996 girls surveyed, and about 45% of them play video games.
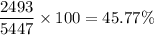
C. There were 5,447 students surveyed, and about 54% of them do not play video games.
D. There were 2,493 students surveyed, and about 34% of them are girls who do not play video games.

Answers: 2


Other questions on the subject: Mathematics
Mathematics, 21.06.2019 16:00, Xghoued2056
Apark is in the shape of a rectangle. the park authorities are planning to build a 2-meter-wide jogging path in the park (shown as the shaded region in the image). what is the area of the jogging path? plz
Answers: 1
Mathematics, 21.06.2019 19:40, payshencec21
Which of the following three dimensional figures has a circle as it’s base
Answers: 2
Mathematics, 22.06.2019 01:30, zitterkoph
The box plots show the distributions of the numbers of words per line in an essay printed in two different fonts.which measure of center would be best to compare the data sets? the median is the best measure because both distributions are left-skewed.the mean is the best measure because both distributions are left-skewed.the median is the best measure because both distributions are symmetric.the mean is the best measure because both distributions are symmetric
Answers: 1
Do you know the correct answer?
A newspaper conducted a survey to find out how many high school students play video games. The two-w...
Questions in other subjects:

English, 25.08.2019 00:30
English, 25.08.2019 00:30


Mathematics, 25.08.2019 00:30


