


This Question: 4 pts
1 of 11 (0 complete)
Music Preferences
Students at a high school wer...

Mathematics, 09.06.2020 21:57, jesser9
This Question: 4 pts
1 of 11 (0 complete)
Music Preferences
Students at a high school were polled to determine the type of music they preferred. There were 1960 students who
completed the poll. Their responses are represented in the circle graph.
Rap 916
Alternative 46
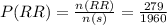
Rock and Roll 279
Country 183
Jazz 32
Other 89
About What % of the students who completed the poll preferred rock and roll music.
(Round to one decimal place as needed.)

Answers: 2
Other questions on the subject: Mathematics
Mathematics, 21.06.2019 20:30, strodersage
Ametal rod is 2/5 meters long. it will be cut into pieces that are each 1/30 meters long. how many pieces will be made from the rod?
Answers: 1
Mathematics, 21.06.2019 22:00, costel8532
Which of the following graphs could represent a cubic function?
Answers: 1
Mathematics, 22.06.2019 03:30, ddwithdadarco
Given the equation −4 = 12, solve for x and identify if it is an extraneous solution.
Answers: 1
Do you know the correct answer?
Questions in other subjects:


Mathematics, 13.01.2020 05:31

History, 13.01.2020 05:31
Mathematics, 13.01.2020 05:31


