


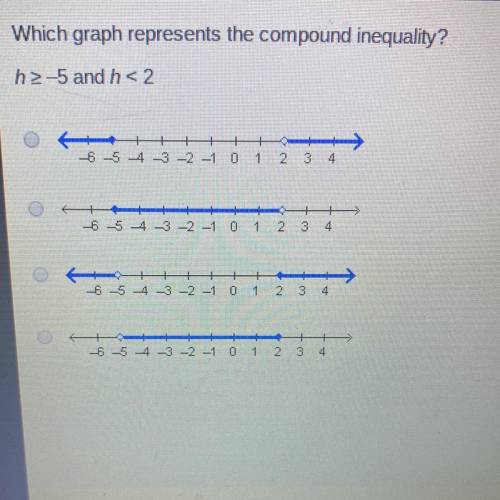
Which graph represents the compound inequality?
h2-5 and h< 2
-6 -5 -4 -3 -2 -1 0 1 2 3 4<...

Mathematics, 08.06.2020 06:57, chloeethoma24
Which graph represents the compound inequality?
h2-5 and h< 2
-6 -5 -4 -3 -2 -1 0 1 2 3 4
+
-6 -5 -4 -3 -2 -1 0 1 2 3 4
+
|-6 -5 4 -3 -2 -1 0 1 2 3 4
>
-6 -5 -4 -3 -2 -1 0 1 2 3

Answers: 2
Other questions on the subject: Mathematics
Mathematics, 21.06.2019 19:10, KariSupreme
At a kentucky friend chicken, a survey showed 2/3 of all people preferred skinless chicken over the regular chicken. if 2,400 people responded to the survey, how many people preferred regular chicken?
Answers: 1
Mathematics, 21.06.2019 23:30, webbhlharryteach
Ateacher wanted to buy a chair, a bookshelf, two tables and a desk. she spent $900 for all five items and the chair and the desk combined 70% of her total. if the bookshelf cost $50, how much did each of the tables cost?
Answers: 1
Mathematics, 21.06.2019 23:30, teenybug56
If a runner who runs at a constant speed of p miles per hour runs a mile in exactly p minutes what is the integer closest to the value p
Answers: 2
Mathematics, 22.06.2019 02:00, lanashanabJHsbd1099
Keith runs 5 miles in 38 minutes. at the same rate, how many miles would he run in 57 minutes
Answers: 1
Do you know the correct answer?
Questions in other subjects:

English, 03.06.2022 23:00
Mathematics, 03.06.2022 23:20
Mathematics, 03.06.2022 23:20
Mathematics, 03.06.2022 23:20
English, 03.06.2022 23:20

History, 03.06.2022 23:40
Mathematics, 03.06.2022 23:50

Spanish, 04.06.2022 01:00


