

Mathematics, 07.06.2020 00:04, liltweetypie08ovdod4
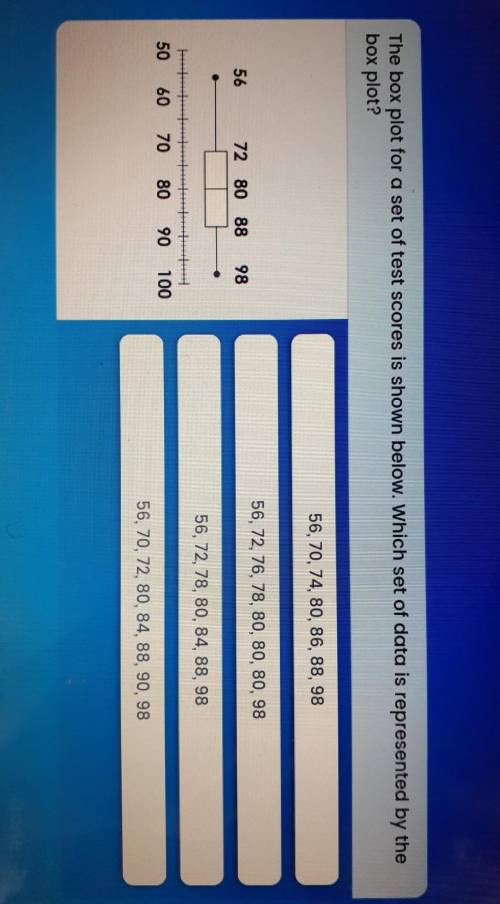
The box plot for a set of test scores is shown below. Which set of data is represented by the
box plot?
56, 70, 74, 80, 86, 88, 98
56, 72, 76, 78, 80, 80, 80, 98
56
72 80 88
98
56, 72, 78, 80, 84, 88, 98
50 60
70
80
90
100
56, 70, 72, 80, 84, 88, 90, 98

Answers: 3


Other questions on the subject: Mathematics
Mathematics, 21.06.2019 19:00, glowbaby123
Tabby sells clothing at a retail store, and she earns a commission of 6.25% on all items she sells. last week she sold a pair of jeans for $32.50, a skirt for $18.95, and 2 blouses for $14.95 each. what was tabby's total commission? a $4.15 b $5.08 c $81.35 d $348.60
Answers: 3
Mathematics, 21.06.2019 20:00, madisonrosamond99
Guys i need ! graded assignment grade 8 checkpoint 2, part 2 answer the questions below. when you are finished, submit this assignment to your teacher by the due date for full credit. total score: of 9 points (score for question 1: of 4 points) 1. the cost of renting a car for a day is $0.50 per mile plus a $15 flat fee. (a) write an equation to represent this relationship. let x be the number of miles driven and y be the total cost for the day. (b) what does the graph of this equation form on a coordinate plane? explain. (c) what is the slope and the y-intercept of the graph of the relationship? explain.
Answers: 1
Do you know the correct answer?
The box plot for a set of test scores is shown below. Which set of data is represented by the
box p...
Questions in other subjects:
Mathematics, 05.05.2021 01:00


English, 05.05.2021 01:00

Mathematics, 05.05.2021 01:00


