


Z = -1.21
z = 0.84
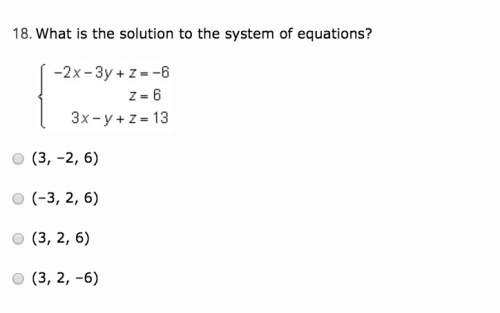
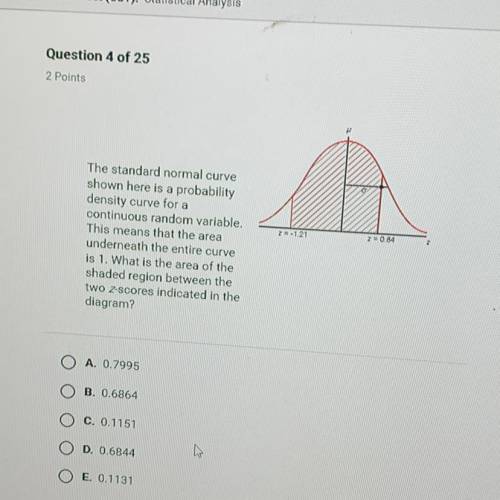
The standard normal curve
shown here is a probability
density...

Mathematics, 06.06.2020 03:57, aronhaile
Z = -1.21
z = 0.84
The standard normal curve
shown here is a probability
density curve for a
continuous random variable.
This means that the area
underneath the entire curve
is 1. What is the area of the
shaded region between the
two z-scores indicated in the
diagram?
A. 0.7995
B. 0.6864
C. 0.1151
D. 0.6844
E. 0.1131

Answers: 3
Other questions on the subject: Mathematics
Mathematics, 21.06.2019 16:30, unicornpoop54
Arandom sample of 150 high school students were asked whether they have a job. the results are shown in the table. have a job do not have a job male 48 35 female 41 26 select a ord or phrase from the drop-down menus to correctly complete the statements describing the association.
Answers: 1
Mathematics, 21.06.2019 21:30, stressedmolly8387
An annual marathon covers a route that has a distance of approximately 26 miles. winning times for this marathon are all over 2 hours. the following data are the minutes over 2 hours for the winning male runners over two periods of 20 years each. earlier period 14 12 15 22 13 10 19 13 9 14 20 18 16 20 23 12 18 17 6 13 recent period 7 11 7 14 8 9 11 14 8 7 9 8 7 9 9 9 9 8 10 8 (a) make a stem-and-leaf display for the minutes over 2 hours of the winning times for the earlier period. use two lines per stem. (use the tens digit as the stem and the ones digit as the leaf. enter none in any unused answer blanks. for more details, view how to split a stem.) minutes beyond 2 hours earlier period 0 1 2 (b) make a stem-and-leaf display for the minutes over 2 hours of the winning times for the recent period. use two lines per stem. (use the tens digit as the stem and the ones digit as the leaf. enter none in any unused answer blanks.) minutes beyond 2 hours recent period (c) compare the two distributions. how many times under 15 minutes are in each distribution
Answers: 2
Mathematics, 22.06.2019 00:40, Hjackson24
What is the interquartile range (iqr) of the data set represented by this box plot?
Answers: 3
Do you know the correct answer?
Questions in other subjects:

Geography, 12.11.2020 20:10
Mathematics, 12.11.2020 20:10

English, 12.11.2020 20:10

History, 12.11.2020 20:10

Chemistry, 12.11.2020 20:10

Mathematics, 12.11.2020 20:10


