

Mathematics, 05.06.2020 00:58, vibezkj
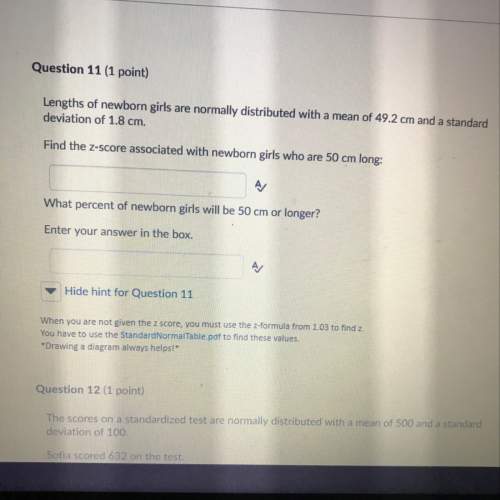
These box plots represent the number of seconds that a random sample of 100 traffic lights are red in each of two cities: Johnstown and Martinville. Based on the data in the two box plots, which statement about the difference in the medians of the two data sets is true?

Answers: 3


Other questions on the subject: Mathematics
Mathematics, 21.06.2019 15:00, denisebaslee15
Of four points are collinear, they are also coplanar
Answers: 2
Mathematics, 21.06.2019 17:30, sarahhfaithhh
One line passes through (-7,-4) and (5,4) . another line passes through the point (-4,6) and (6,-9)
Answers: 1
Mathematics, 21.06.2019 19:00, ALEXMASTERS64
Moira has a canvas that is 8 inches by 10 inches. she wants to paint a line diagonally from the top left corner to the bottom right corner. approximately how long will the diagonal line be?
Answers: 1
Mathematics, 21.06.2019 20:30, kalliebjones4511
Carley bought a jacket that was discounted 10% off the original price. the expression below represents the discounted price in dollars, based on x, the original price of the jacket.
Answers: 1
Do you know the correct answer?
These box plots represent the number of seconds that a random sample of 100 traffic lights are red i...
Questions in other subjects:


History, 26.06.2019 20:30

English, 26.06.2019 20:30


