

Mathematics, 03.06.2020 13:07, haha81
According to the historical data, the life expectancy in Argentina is equal to the life expectancy in Bolivia. A new study has been made to see whether this has changed. Records of 265 individuals from Argentina who died recently are selected at random. The 265 individuals lived an average of 74.8 years with a standard deviation of 4.1 years. Records of 300 individuals from Bolivia who died recently are selected at random and independently. The 300 individuals lived an average of 75.4 years with a standard deviation of 4.3 years. Assume that the population standard deviation of the life expectancy can be estimated by the sample standard deviations, since the samples that are used to compute them are quite large. At the 0.05 level of significance, is there enough evidence to support the claim that the life expectancy, μ1, in Argentina is not equal to the life expectancy, μ2, in Bolivia anymore? Perform a two-tailed test. Then fill in the table below.
Carry your intermediate computations to at least three decimal places and round your answers as specified in the table. (If necessary, consult a list of formulas.)
The null hypothesis: H sub 0:
The alternative hypothesis: H sub 1:
The type of test statistic:
The value of the test statistic:
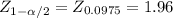
The two critical values at the 0.05 level of significance:
Can we support the claim that the life expectancy in Argentina is not equal to the life expectancy in Bolivia? Yes or No

Answers: 1
![Z= \frac{(X[bar]_1-X[bar]_2)-(Mu_1-Mu_2)}{\sqrt{\frac{S^2_1}{n_1} +\frac{S_2^2}{n_2} } }](/tpl/images/0674/5410/a4a01.png) ≈N(0;1)
≈N(0;1)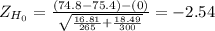
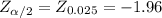
 ≤ -1.96 or if

Other questions on the subject: Mathematics
Mathematics, 21.06.2019 14:50, sherry59Sherry59
What is the vertex form of f(x) = x2 + 6x + 3
Answers: 2
Mathematics, 21.06.2019 20:00, gordon57
Someone answer asap for ! max recorded the heights of 500 male humans. he found that the heights were normally distributed around a mean of 177 centimeters. which statements about max’s data must be true? a. the median of max’s data is 250 b. more than half of the data points max recorded were 177 centimeters. c. a data point chosen at random is as likely to be above the mean as it is to be below the mean. d. every height within three standard deviations of the mean is equally likely to be chosen if a data point is selected at random.
Answers: 1
Mathematics, 21.06.2019 23:30, huneymarie
What are the coordinates of the image of p for a dilation with center (0, 0) and scale factor 2
Answers: 1
Do you know the correct answer?
According to the historical data, the life expectancy in Argentina is equal to the life expectancy i...
Questions in other subjects:

Biology, 22.08.2019 01:10


Social Studies, 22.08.2019 01:10


