
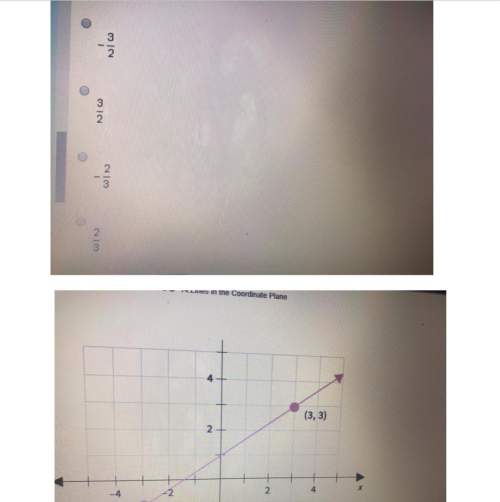


Select the correct answer from each drop-down menu.
Interpret the histogram of Gretchen’s data...

Mathematics, 02.06.2020 20:58, theflash077
Select the correct answer from each drop-down menu.
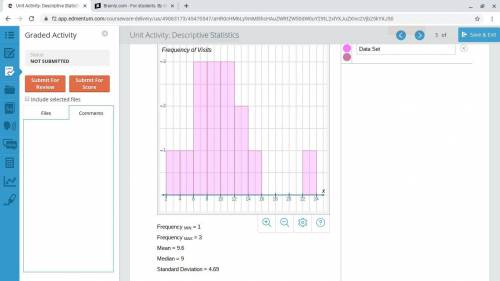
Interpret the histogram of Gretchen’s data you created (pictured below)
The shape of Gretchen’s data can be described as.
1.)Skewed left
2.)Skewed right
3.)Symmetrical
Because of this, the...
1,)Mean
2.)Median
would be the best measure of center for this data set. The actual value for the best measure of center is...
1.)7
2.)9
3.)9.1
4.)9.6

Answers: 3
Other questions on the subject: Mathematics
Mathematics, 21.06.2019 21:30, bryantfoster
Helll ! 1,400 tons of wheat of two different varieties was delivered to the silo. when processing one variety, there was 2% of waste and 3% during the processing of the second variety of wheat. after the processing, the amount of remaining wheat was 1,364 tons. how many tons of each variety of wheat was delivered to the silo?
Answers: 1
Mathematics, 21.06.2019 22:00, HistoryLee
You are standing next to a really big circular lake. you want to measure the diameter of the lake, but you don't want to have to swim across with a measuring tape! you decide to walk around the perimeter of the lake and measure its circumference, and find that it's 400\pi\text{ m}400? m. what is the diameter dd of the lake?
Answers: 3
Mathematics, 22.06.2019 00:30, qqbear4555
(c) a vine called the mile-a-minute weed is known for growing at a very fast rate. it can grow up to 0.5 ft per day. how fast in inches per hour can the mile-a-minute weed grow up to? show your work using the correct conversion factors.
Answers: 1
Do you know the correct answer?
Questions in other subjects:

Biology, 24.01.2021 20:10
Mathematics, 24.01.2021 20:10
Mathematics, 24.01.2021 20:10

English, 24.01.2021 20:10
Biology, 24.01.2021 20:10


