

Mathematics, 01.06.2020 06:58, STAYxALIVE7814
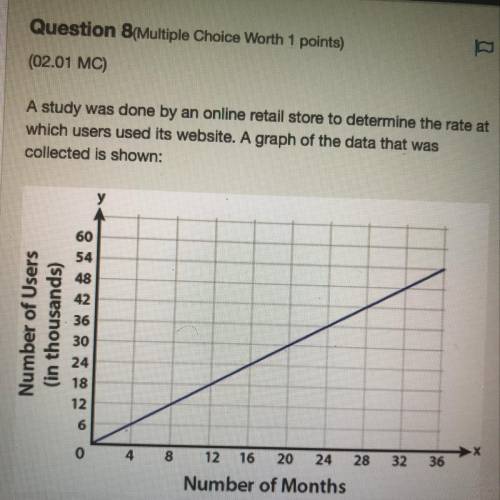
A study was done by an online retail store to determine the rate at which users used its website. A graph of the data that was collected is shown:
A. The range represents the 54 month time period of the study.
B. The range represents the 36 month time period of the study.
C. The range represents the number of users each month for 36 months.
D. The range represents the number of users each month for 54 months.

Answers: 2


Other questions on the subject: Mathematics
Mathematics, 21.06.2019 13:20, Delgadojacky0206
At school there are 526 students and 263 are girls about how likely is it that a randomly chosen student will be a boy
Answers: 2
Mathematics, 21.06.2019 20:30, avahrider1
The distance of a chord from the centre of a circle is 12cm and the lenght of the chord is 10cm. find the radius of the circle
Answers: 1
Do you know the correct answer?
A study was done by an online retail store to determine the rate at which users used its website. A...
Questions in other subjects:


Mathematics, 15.07.2019 12:00


