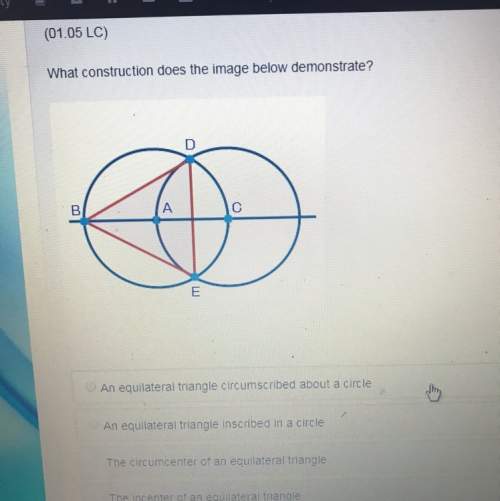
The table shows the heights and the lengths of several rectangles.
Height (in.) 41 70 21...

Mathematics, 02.06.2020 02:57, debramknoxx
The table shows the heights and the lengths of several rectangles.
Height (in.) 41 70 21 34 10 92 54 24 10 35 42 66
Length (in.) 21 25 32 12 16 45 40 23 45 35 21 14
What does the correlation coefficient for the data indicate about the strength of the linear association between the height and the length of these rectangles?
A.
Weak negative correlation
B.
Strong negative correlation
C.
Weak positive correlation
D.
Strong positive correlation

Answers: 2
Other questions on the subject: Mathematics

Mathematics, 21.06.2019 16:00, alannismichelle9
In the diagram, the ratio of ab to ae is (1/2) . what is the ratio of the length of to the length of ?
Answers: 3


Mathematics, 21.06.2019 22:20, ineedhelp2285
The figure shows triangle def and line segment bc, which is parallel to ef: triangle def has a point b on side de and point c on side df. the line bc is parallel to the line ef. part a: is triangle def similar to triangle dbc? explain using what you know about triangle similarity. part b: which line segment on triangle dbc corresponds to line segment ef? explain your answer. part c: which angle on triangle dbc corresponds to angle f? explain your answer. asap
Answers: 3
Do you know the correct answer?
Questions in other subjects:

Mathematics, 01.07.2019 08:00


History, 01.07.2019 08:00


History, 01.07.2019 08:00


Mathematics, 01.07.2019 08:00


