


The graph below plots the values of y for different values of x: (look at graph picture)
What...

Mathematics, 31.05.2020 00:01, aubrey13m
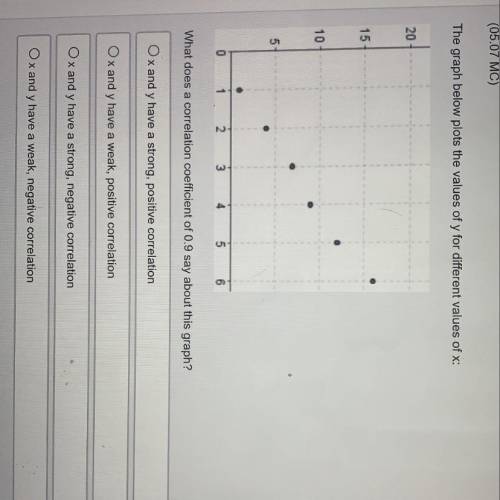
The graph below plots the values of y for different values of x: (look at graph picture)
What does a correlation coefficient of 0.9 say about this graph?
A: x and y have a strong, positive correlation
B: x and y have a weak, positive correlation
C: x and y have a strong, negative correlation
D: x and y have a weak, positive correlation

Answers: 1
Other questions on the subject: Mathematics
Mathematics, 21.06.2019 15:30, chelseychew32
Question 7 of 47 1 point what is the equation of a line with a slope of 1/2 that passes through the point, (-2,5)? o a. 1/2x+3 o b. y=1/2x+5 o c. y=x+5 o d. y=1/2x+6
Answers: 3
Do you know the correct answer?
Questions in other subjects:
Mathematics, 31.07.2019 04:30


Social Studies, 31.07.2019 04:30


