

Mathematics, 30.05.2020 15:58, XOsam
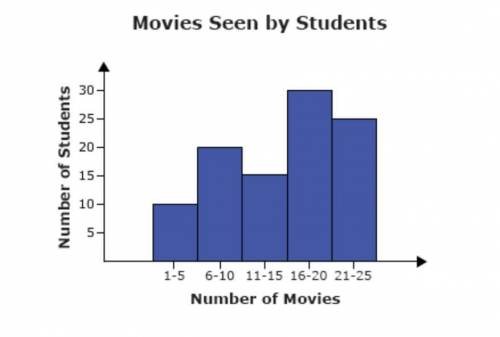
The number of movies seen by students in the 6th grade in the past year is shown in the histogram below. Which of the following statements is true for the data?
A. The majority of students have seen between 6 and 15 movies.
B. The majority of students have seen between 21 and 25 movies
C. The number of movies seen by students in the 6th grade range between 1 and 25.
D. The number of movies seen by students in the 6th grade range between 1 and 15.

Answers: 3


Other questions on the subject: Mathematics
Mathematics, 22.06.2019 01:30, jude40
Asample of 200 rom computer chips was selected on each of 30 consecutive days, and the number of nonconforming chips on each day was as follows: the data has been given so that it can be copied into r as a vector. non. conforming = c(10, 15, 21, 19, 34, 16, 5, 24, 8, 21, 32, 14, 14, 19, 18, 20, 12, 23, 10, 19, 20, 18, 13, 26, 33, 14, 12, 21, 12, 27) #construct a p chart by using the following code. you will need to enter your values for pbar, lcl and ucl. pbar = lcl = ucl = plot(non. conforming/200, ylim = c(0,.5)) abline(h = pbar, lty = 2) abline(h = lcl, lty = 3) abline(h = ucl, lty = 3)
Answers: 3
Mathematics, 22.06.2019 03:00, Michcardwell8570
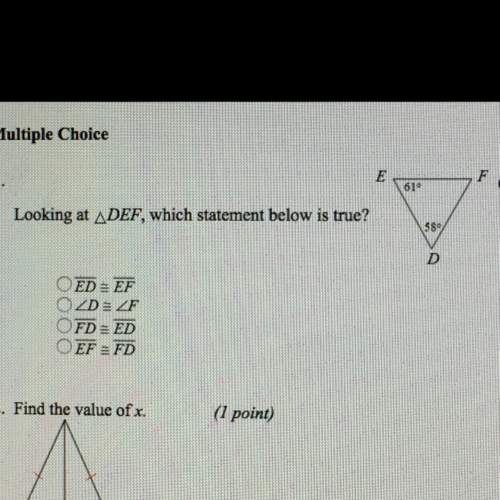
With this question, the answer with the red arrow is incorrect!
Answers: 1
Do you know the correct answer?
The number of movies seen by students in the 6th grade in the past year is shown in the histogram be...
Questions in other subjects:

Mathematics, 01.02.2021 20:50
Mathematics, 01.02.2021 20:50

Mathematics, 01.02.2021 20:50


Mathematics, 01.02.2021 20:50


