

Mathematics, 28.05.2020 20:05, lilpeepxliltracy
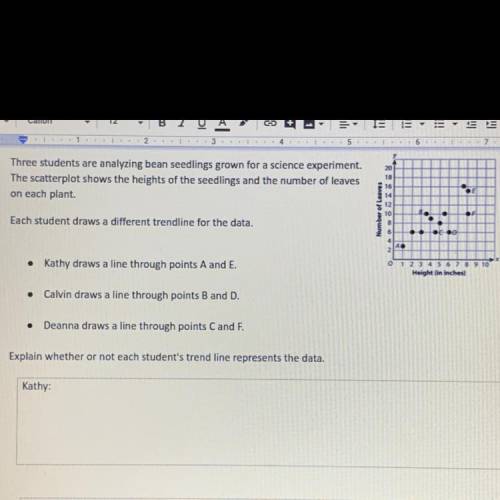
Three students are analyzing bean seedlings grown for a science experiment The scatterplot shows the heights of the seedlings and the number of leaves on each plant.
Each student draws a different tread line for the data.
-Kathy draws a line through points A and E.
-Calvin draws a line through points B and D.
-Deanna draws a line through points C and F.
Explain whether or not each student’s trend line represents the data.

Answers: 3


Other questions on the subject: Mathematics
Mathematics, 21.06.2019 22:00, Supermate11
The number of calories you burn depends on your weight. a 110-pound person burns 163 calories during 30 minutes of tennis. find the number of calories that a 190-pound person would burn during the same activity, assuming they burn calories at the same rate.
Answers: 1
Mathematics, 22.06.2019 04:00, meghan2529
The length of a rectangular plot of land is given by the expression 6x^3y^4. the width of the plot is given by the expression 5x^5y^4z. find an expression to represent the area of the rectangular plot.
Answers: 1
Mathematics, 22.06.2019 04:00, GodlyGamer8239
Write a function rule for “the output is 5 less than the input.” let xx be the input and let yy be the output.
Answers: 3
Do you know the correct answer?
Three students are analyzing bean seedlings grown for a science experiment The scatterplot shows the...
Questions in other subjects:

Mathematics, 11.05.2021 19:50

Mathematics, 11.05.2021 19:50


History, 11.05.2021 19:50


