


1. Make predictions
Vacation Survey
The circle graph shows the results of a survey of te...

Mathematics, 28.05.2020 23:06, annapittbull12
1. Make predictions
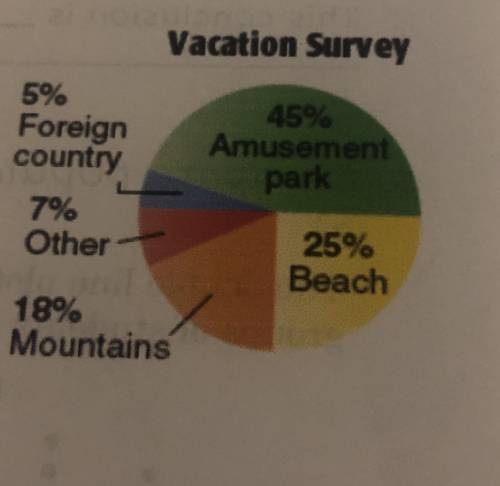
Vacation Survey
The circle graph shows the results of a survey of teens and where
they would prefer to spend a family vacation. Predict how many of
4,000 teens would prefer to go to an amusement park.

Answers: 3
Other questions on the subject: Mathematics
Mathematics, 21.06.2019 15:30, CoreyHammond1517
Click on the y intercept. -x +4 i know you cant click on it so could you just say the coordinates like (example - (1,0) you so much.
Answers: 2
Mathematics, 21.06.2019 19:00, shadow29916
Solve x+3y=6 and 4x-6y=6 by elimination . show work !
Answers: 1
Mathematics, 21.06.2019 21:30, noelia2001guzman
Madeline takes her family on a boat ride. going through york canal, she drives 6 miles in 10 minutes. later on as she crosses stover lake, she drives 30 minutes at the same average speed. which statement about the distances is true?
Answers: 3
Mathematics, 21.06.2019 23:40, preciosakassidy
The frequency table shows the results of a survey asking people how many hours they spend online per week. on a piece of paper, draw a histogram to represent the data. then determine which answer choice matches the histogram you drew. in order here is the.. hours online: 0-3, 4-7, 8-11, 12-15, and 16-19. frequency: 5, 8, 10, 8, 7 answer for the question is in the picture! : )
Answers: 2
Do you know the correct answer?
Questions in other subjects:
Mathematics, 25.02.2021 14:00
Mathematics, 25.02.2021 14:00
Mathematics, 25.02.2021 14:00

English, 25.02.2021 14:00

Chemistry, 25.02.2021 14:00
Mathematics, 25.02.2021 14:00

History, 25.02.2021 14:00
History, 25.02.2021 14:00


