


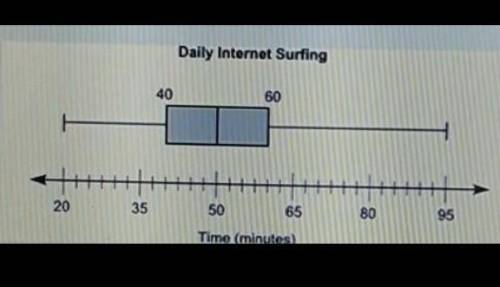
The box plot below shows the total amount of time, in minutes, the students of a
Part A: List...

Mathematics, 28.05.2020 13:59, popa60
The box plot below shows the total amount of time, in minutes, the students of a
Part A: List two pieces of information that are provided by the graph and one piece of information that is not provided by the graph (4 points)
Part B: Calculate the interquartile range of the data, and explain in a sentence or two what it represents. (4 points)
Part C: Explain what affect, if any, there will be if an outlier is present (2 points)
PLEASE NO GUESSING, THANK YOU :)

Answers: 2
Other questions on the subject: Mathematics
Mathematics, 21.06.2019 23:20, jslaughter3
What is the slope of the line that contains the points (-5, 6) and (14. - 7)?
Answers: 1
Do you know the correct answer?
Questions in other subjects:
Mathematics, 05.05.2020 03:02

History, 05.05.2020 03:02

Chemistry, 05.05.2020 03:02
Mathematics, 05.05.2020 03:02

English, 05.05.2020 03:02

SAT, 05.05.2020 03:02

Physics, 05.05.2020 03:02

Biology, 05.05.2020 03:02
History, 05.05.2020 03:02


