

Mathematics, 28.05.2020 10:57, blan69
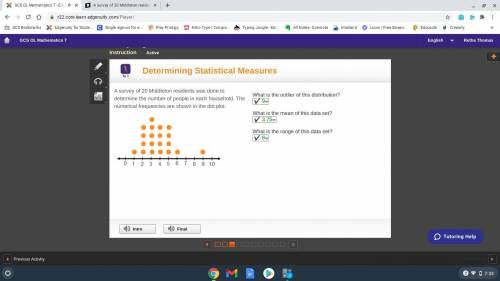
A survey of 20 Middleton residents was done to determine the number of people in each household. The numerical frequencies are shown in the dot plot. A dot plot. The number line goes from 0 to 10. There is 1 dot above 1, 4 above 2, 5 above 3, 4 above 4, 4 above 5, 1 above 6, 0 above 7, 0 above 8, 1 above 9, 0 above 10. What is the outlier of this distribution? What is the mean of this data set? What is the range of this data set?

Answers: 3


Other questions on the subject: Mathematics
Mathematics, 21.06.2019 18:30, luvme68297
Which statement justifies why angle ebc measures 90?
Answers: 3
Mathematics, 21.06.2019 20:30, Cheyenne8694
Stacey filled her 1/2 cup of measuring cup seven times to have enough flour for a cake recipe how much flour does the cake recipe calls for
Answers: 2
Do you know the correct answer?
A survey of 20 Middleton residents was done to determine the number of people in each household. The...
Questions in other subjects:

History, 18.03.2021 02:50

Computers and Technology, 18.03.2021 02:50
Mathematics, 18.03.2021 02:50
Mathematics, 18.03.2021 02:50

English, 18.03.2021 02:50
Mathematics, 18.03.2021 02:50

Chemistry, 18.03.2021 02:50
Mathematics, 18.03.2021 02:50


