


Choose the function whose graph is given below.
A. y = cotx
B. y = CSC X
C....

Mathematics, 27.05.2020 23:08, hdjsjshshsh
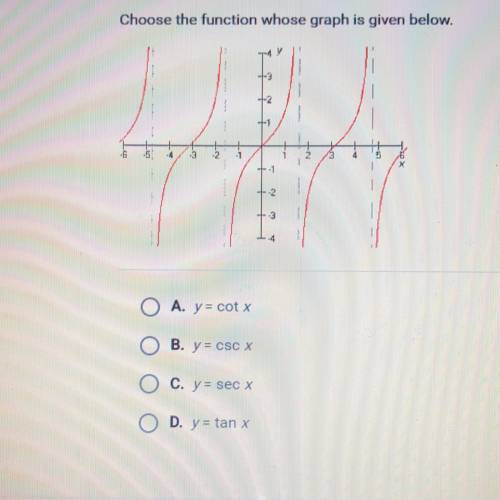
Choose the function whose graph is given below.
A. y = cotx
B. y = CSC X
C. y= sec x
D. y = tan x

Answers: 1
Other questions on the subject: Mathematics
Mathematics, 21.06.2019 14:30, chintiffany4779
Describe in detail how you would construct a 95% confidence interval for a set of 30 data points whose mean is 20 and population standard deviation is 3. be sure to show that you know the formula and how to plug into it. also, clearly state the margin of error.
Answers: 3
Mathematics, 21.06.2019 18:20, genyjoannerubiera
17. a researcher measures three variables, x, y, and z for each individual in a sample of n = 20. the pearson correlations for this sample are rxy = 0.6, rxz = 0.4, and ryz = 0.7. a. find the partial correlation between x and y, holding z constant. b. find the partial correlation between x and z, holding y constant. (hint: simply switch the labels for the variables y and z to correspond with the labels in the equation.) gravetter, frederick j. statistics for the behavioral sciences (p. 526). cengage learning. kindle edition.
Answers: 2
Do you know the correct answer?
Questions in other subjects:


History, 28.10.2019 20:31


Arts, 28.10.2019 20:31


