


Ms. Cebrera counted the number of absences each student in her class had last year.
She record...

Mathematics, 26.05.2020 19:02, lohggg
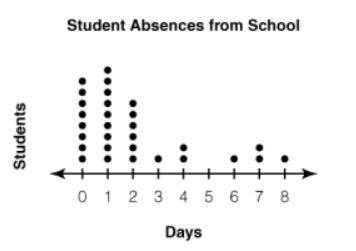
Ms. Cebrera counted the number of absences each student in her class had last year.
She recorded the results on the dot plot below.
Dot plot named as ALTDCStudent Absences from SchoolALTDC has number line from 0 to 8. 8 dots on 0, 9 dots on 1, 6 dots on 2, 1 dot on 3, 2 dots on 4, 1 dot on 6, 2 dots on 7 and 1 dot on 8 is given.
Which statement best describes the shape of the data?
A.
pulled to the left
B.
pulled to the right
C.
symmetric
D.
no noticeable shape

Answers: 2
Other questions on the subject: Mathematics
Mathematics, 21.06.2019 13:10, lwilliams28
Which of the following would represent the sum of 3 consecutive integers if x is the first integer?
Answers: 3
Mathematics, 21.06.2019 18:00, jenniferkane408
Look at arnold's attempt to solve the equation for b: 3b = 12 b = 3 · 12 b = 36 describe the mistake that arnold made.
Answers: 2
Do you know the correct answer?
Questions in other subjects:


