


Ms. Cebrera counted the number of absences each student in her class had last year.
She record...

Mathematics, 27.05.2020 18:02, jordivivar74
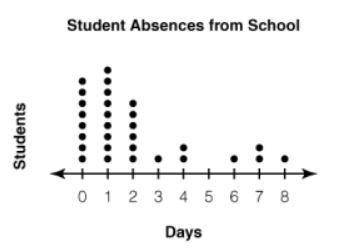
Ms. Cebrera counted the number of absences each student in her class had last year.
She recorded the results on the dot plot below.
Dot plot named as ALTDCStudent Absences from SchoolALTDC has number line from 0 to 8. 8 dots on 0, 9 dots on 1, 6 dots on 2, 1 dot on 3, 2 dots on 4, 1 dot on 6, 2 dots on 7 and 1 dot on 8 is given.
Which statement best describes the shape of the data?
A.
pulled to the left
B.
pulled to the right
C.
symmetric
D.
no noticeable shape

Answers: 2
Other questions on the subject: Mathematics
Mathematics, 21.06.2019 13:50, monaae3824
Given the function f(x) = 3x + 1, evaluate f(a + 1). a. 3a + 1 b. a + 2 c. 3a + 4
Answers: 1
Do you know the correct answer?
Questions in other subjects:

Chemistry, 27.07.2019 15:00
Mathematics, 27.07.2019 15:00


Biology, 27.07.2019 15:00

Social Studies, 27.07.2019 15:00
Social Studies, 27.07.2019 15:00

Computers and Technology, 27.07.2019 15:00


