


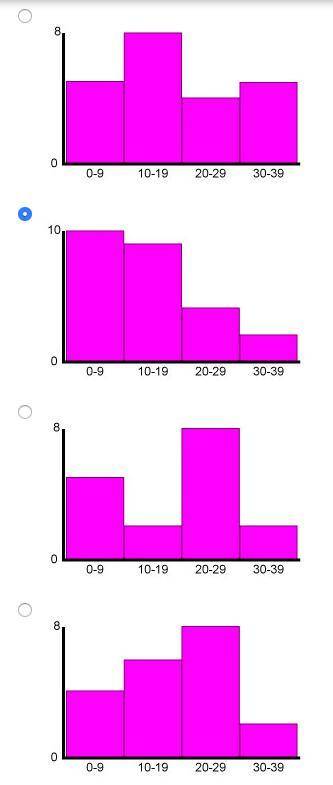
Which of the following histograms represents this set of data?
2, 3, 1, 10, 14, 22, 19,...

Mathematics, 25.05.2020 09:57, buglerboy979
Which of the following histograms represents this set of data?
2, 3, 1, 10, 14, 22, 19, 28, 6, 11, 34, 30, 6, 18, 19, 20, 14, 29, 5, 9, 7, 9, 12, 3, 10
(Ignore the already marked one)

Answers: 2
Other questions on the subject: Mathematics
Mathematics, 21.06.2019 21:30, girlysimbelieve
Aroulette wheel has 38 slots in which the ball can land. two of the slots are green, 18 are red, and 18 are black. the ball is equally likely to land in any slot. the roulette wheel is going to be spun twice, and the outcomes of the two spins are independent. the probability that it lands one time on red and another time on black in any order is(a) 0.5 (b) 0.25 (c) 0.4488 (d) 0.2244
Answers: 1
Mathematics, 21.06.2019 21:30, thompsonmark0616
Find the domain and range of the following function f(x) = 51x - 21+ 4
Answers: 2
Do you know the correct answer?
Questions in other subjects:


Biology, 24.06.2019 02:20


Mathematics, 24.06.2019 02:20
Mathematics, 24.06.2019 02:20


