

Mathematics, 24.05.2020 05:57, hibah2004
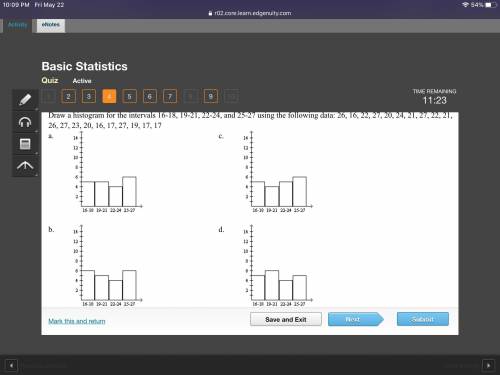
Draw a histogram for the intervals 16-18, 19-21, 22-24, and 25-27 using the following data: 26, 16, 22, 27, 20, 24, 21, 27, 22, 21, 26, 27, 23, 20, 16, 17, 27, 19, 17, 17

Answers: 2


Other questions on the subject: Mathematics
Mathematics, 21.06.2019 18:00, phillipsk5480
Express in the simplest form: (x^2+9x+14/x^2-49) / (3x+6/x^2+x-56)
Answers: 3
Mathematics, 21.06.2019 23:00, lizbethmillanvazquez
Apackage of orgainc strwberries costs $1.50 while there in season and $2.25 when not in season what the percent increase
Answers: 1
Mathematics, 21.06.2019 23:30, shadowz8813
Johnny rode his bike to a friends house 4 blocks down the street in his neighborhood. he immediately rode back home once he realized his friend was unable to play. what was his displacement for the total bike ride trip? what could you use as a reference point ? show the steps to solve this problem.
Answers: 3
Do you know the correct answer?
Draw a histogram for the intervals 16-18, 19-21, 22-24, and 25-27 using the following data: 26, 16,...
Questions in other subjects:

Business, 08.10.2021 06:00
Mathematics, 08.10.2021 06:00

Physics, 08.10.2021 06:00

Mathematics, 08.10.2021 06:00
Business, 08.10.2021 06:00

Social Studies, 08.10.2021 06:00

Engineering, 08.10.2021 06:00


