

Mathematics, 24.05.2020 01:58, aiueo6692
A manager is assessing the correlation between the number of employees in a plant and the number of products produced yearly. The table shows the data:
Number of employees
(x) 0 25 50 75 100 125 150 175 200
Number of products
(y) 10 160 310 460 610 760 910 1060 1210
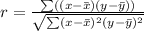
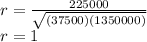
Part A: Is there any correlation between the number of employees in the plant and the number of products produced yearly? Justify your answer. (4 points)
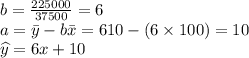
Part B: Write a function that best fits the data. (3 points)
Part C: What does the slope and y-intercept of the plot indicate? (3 points)

Answers: 3


Other questions on the subject: Mathematics
Mathematics, 21.06.2019 18:20, katlynnschmolke
What is the solution set of the quadratic inequality x2- 5< 0? o {xl-55x55{x- 155x55){xl -55x5 15){x1 - 15 sx5/5)
Answers: 2
Mathematics, 21.06.2019 22:00, JNH16
The numbers on a football field indicate 10 yard increments. you walk around the perimeter of a football field between the pylons. you walk a distance of 30623 yards. find the area and perimeter of the indicated regions. write your answers as mixed numbers, if necessary. a. one end zone: perimeter: yd area: yd2 b. the playing field (not including end zones): perimeter: yd area: yd2 c. the playing field (including end zones): perimeter: yd area: yd2
Answers: 1
Do you know the correct answer?
A manager is assessing the correlation between the number of employees in a plant and the number of...
Questions in other subjects:
Mathematics, 21.10.2020 08:01
Mathematics, 21.10.2020 08:01

History, 21.10.2020 08:01

English, 21.10.2020 08:01
Mathematics, 21.10.2020 08:01
Mathematics, 21.10.2020 08:01
Mathematics, 21.10.2020 08:01

Health, 21.10.2020 08:01


