

Mathematics, 23.05.2020 02:03, Gabbymadrid3240
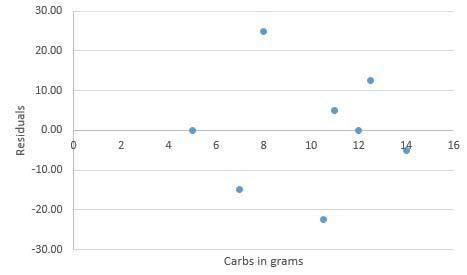
The predicted calories in food items based on grams of carbs are represented by the residual plot.
Residual plot with x-axis labeled carbs in grams and y-axis labeled residuals. There are eight points plotted 5 and 0, 7 and negative 15, 8 and 25, 10.5 and negative 22.5, 11 and 5, 12 and 0, 12.5 and 12.5, and 14 and negative 5.
What does the pattern in the residual plot indicate about the type of model? (4 points)
Group of answer choices
The pattern is random, indicating a good fit for a nonlinear model.
The pattern is random, indicating a good fit for a linear model.
The pattern shows the points are far from the zero line, indicating a good fit for a linear model.
The pattern shows the points are far from the zero line, indicating a good fit for a nonlinear model.

Answers: 2


Other questions on the subject: Mathematics
Mathematics, 21.06.2019 15:30, cbaillie8462
20 only answer if 100% sure most high school-aged teens are very active. a. true b. false
Answers: 2
Do you know the correct answer?
The predicted calories in food items based on grams of carbs are represented by the residual plot.
Questions in other subjects:

Biology, 17.01.2020 04:31


Mathematics, 17.01.2020 04:31

Mathematics, 17.01.2020 04:31


