

Mathematics, 23.05.2020 21:05, JesuGranger
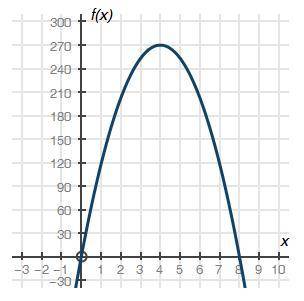
The graph below shows a company's profit f(x), in dollars, depending on the price of erasers x, in dollars, sold by the company:
Part A: What do the x-intercepts and maximum value of the graph represent? What are the intervals where the function is increasing and decreasing, and what do they represent about the sale and profit? (4 points)
Part B: What is an approximate average rate of change of the graph from x = 1 to x = 4, and what does this rate represent? (3 points)
Part C: Describe the constraints of the domain. (3 points)

Answers: 3


Other questions on the subject: Mathematics
Mathematics, 21.06.2019 17:20, ponylover9655
Read the situations in the table below. then drag a graph and equation to represent each situation. indicate whether each of the relationships is proportional or non-proportional. edit : i got the right answer its attached
Answers: 2
Mathematics, 21.06.2019 19:30, johndiaz26
Solve the following inequalities and show the solution on a number line. 2x+3< 3(4x+5)
Answers: 1
Mathematics, 22.06.2019 00:30, desiree6005
Triangle abc has side lengths: ab = 3.5 cm, bc = 2.4 cm, and ac = 4.2 cmδabc ≅ δhjkwhat is the length of side hj?
Answers: 1
Do you know the correct answer?
The graph below shows a company's profit f(x), in dollars, depending on the price of erasers x, in d...
Questions in other subjects:


Chemistry, 05.05.2020 21:22


Mathematics, 05.05.2020 21:22

History, 05.05.2020 21:22


