

Mathematics, 23.05.2020 19:57, zacharysharpe2805
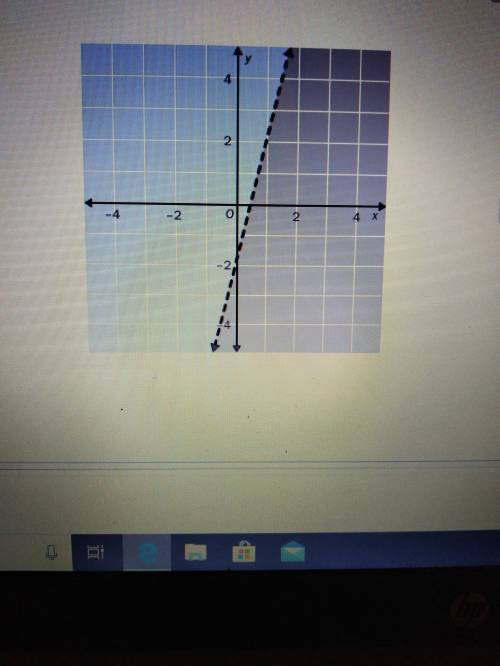
Choose the linear inequality that describes the graph. The gray area represents the shaded region.
A. y ≤ -4x - 2 , B. y > -4x -2 , C. y ≥ -4x - 2 , D. y < 4x -2

Answers: 1


Other questions on the subject: Mathematics
Mathematics, 21.06.2019 23:30, Lkirjnnfcxd5039
The legs of a right triangle measure 6 meters and 8 meters. what is the length of the hypotonuse.
Answers: 1
Mathematics, 21.06.2019 23:40, asiababbie33
Agrid shows the positions of a subway stop and your house. the subway stop is located at (-5,2) and your house is located at (-9,9). what is the distance, to the nearest unit, between your house and the subway stop?
Answers: 1
Do you know the correct answer?
Choose the linear inequality that describes the graph. The gray area represents the shaded region. <...
Questions in other subjects:

Mathematics, 26.02.2020 23:51

Health, 26.02.2020 23:51

Mathematics, 26.02.2020 23:51


