

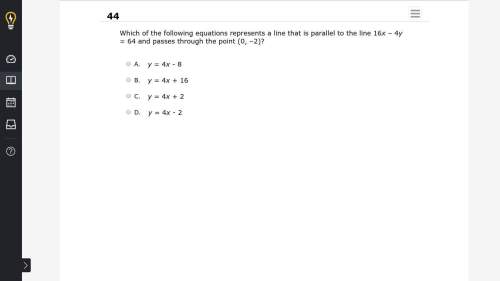
Mathematics, 22.05.2020 02:11, neidaq12345
Suppose a researcher RW decides to give his nine participants a series of 50 photographs. He asks the participants to rank order (from 1-50) how well-dressed the individuals in the photograph were and to rank order (from 1-50) how intelligent they thought the individuals in the photograph were. One of the photographs was of a well known actor. The well-dressed rankings and the intelligence rankings for this one photo are as follows.
WELL-DRESSED INTELLIGENT
14 12
35 39
16 17
41 43
39 40
25 21
26 27
11 9
24 25
RW performs a simple linear regression (with WELL DRESSED as the Independent Variable and INTELLIGENT as the Dependent Variable) and obtains the following results.
Model Summary
Model
R
R Square
Adjusted R Square
Std. Error of the Estimate
1
.988a
.975
.972
2.10093
a. Predictors: (Constant), welldressed
ANOVAa
Model
Sum of Squares
df
Mean Square
F
Sig.
1
Regression
1215.992
1
1215.992
275.492
.000b
Residual
30.897
7
4.414
Total
1246.889
8
a. Dependent Variable: intelligent
b. Predictors: (Constant), welldressed
Coefficientsa
Model
Unstandardized Coefficients
Standardized Coefficients
t
Sig.
B
Std. Error
Beta
1
(Constant)
-3.180
1.886
-1.686
.136
welldressed
1.133
.068
.988
16.598
.000
a. Dependent Variable: intelligent
From these results, he concludes
1. that being well dressed causes people to view you as intelligent.
2. that the linear relationship between well-dressed ratings and intelligence ranks for the photos is Intelligence=-3.180(Well Dressed) + 1.133.
3. that the null hypothesis (b=0) has a probability =.000
4. that since it is desirable to get an R2=1, it may be necessary to add more Independent Variables to the analysis.
5. that with this type of analysis one doesn’t have to worry about being overly influenced by extreme values.
Your task is to answer the following about the above project.
Do you see any problems with the design of the study, the data analysis run, or the results reported?
Are there analyses that should have been run that weren’t? What would you have done? Why?
Do you see any errors in the conclusions reached? If so, what should have been (or should not have been) concluded?
If you feel that other alternative statistical analyses should have been performed, then do them. If you do alternative analyses include any results you have obtained

Answers: 3


Other questions on the subject: Mathematics
Mathematics, 21.06.2019 19:30, ashtonsilvers2003
Evaluate the expression for the given value of the variable. ∣-4b-8∣+∣-1-b^2 ∣+2b^3 ; b=-2
Answers: 2
Do you know the correct answer?
Suppose a researcher RW decides to give his nine participants a series of 50 photographs. He asks th...
Questions in other subjects:

English, 08.02.2021 07:10

History, 08.02.2021 07:10
Mathematics, 08.02.2021 07:10
English, 08.02.2021 07:10


