


PLZZ HELP ASAP The graph of the function f(x) = –(x + 6)(x + 2) is shown below.
Which st...

Mathematics, 20.05.2020 21:03, princesskoi8561
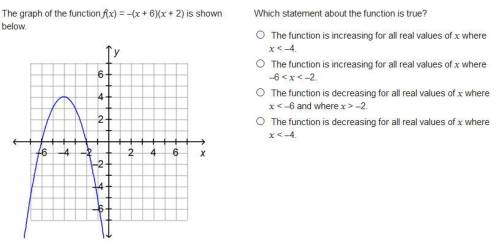
PLZZ HELP ASAP The graph of the function f(x) = –(x + 6)(x + 2) is shown below.
Which statement about the function is true?
The function is increasing for all real values of x where
x < –4.
The function is increasing for all real values of x where
–6 < x < –2.
The function is decreasing for all real values of x where
x < –6 and where x > –2.
The function is decreasing for all real values of x where
x < –4.

Answers: 1
Other questions on the subject: Mathematics
Mathematics, 21.06.2019 15:10, blessing5266
Aline on the wall and a line on the floor are skew. always, sometimes, or never?
Answers: 3
Mathematics, 22.06.2019 02:30, oakleylynn
Find the area of the region between a regular hexagon with sides of 6" and its inscribed circle.
Answers: 1
Mathematics, 22.06.2019 03:20, arangoaiden71
Aconcession manager at yankee stadium wants to know how temperature affects beer sales. she took a sample of 10 games and recorded the number of beers sold and the temperature in the middle of the game. temperature 80 68 78 79 87 74 86 92 77 84 number of beers 20533 1439 13829 21286 30985 17187 30240 87596 9610 28742 a. draw a scatter plot of the data. b. the manager estimates the regression equation to be: numberofbeers = −100, 678 + 1, 513 ∗ temperature draw this on your scatter plot. c. for one of the estimated points, indicate the residual with ei . d. for that same point, indicate what part of the variation is explained by the model with ˆyi − y¯.
Answers: 2
Do you know the correct answer?
Questions in other subjects:


Mathematics, 17.06.2020 04:57

English, 17.06.2020 04:57


Social Studies, 17.06.2020 04:57


