

Mathematics, 20.05.2020 05:57, rileyeddins1010
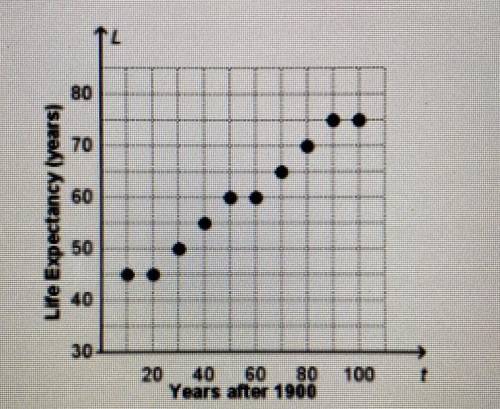
The scatter plot shows the relationship between the time t, in years after 1900, and the life expectancy L. in years, at birth for a certain
country.
Which of the following statements best describes the data on the scatter plot?
a) The data on the scatterplot suggests a linear association that could be modeled by the function L(t) - 39.67t +0.37.
b) The data on the scatterplot suggests a linear association that could be modeled by the function L(t) = -0.24t+74.33
c) The data on the scatterplot suggests a linear association that could be modeled by the function L(t) -0.37t +39.67.
d) The data on the scatter plot does not suggest a linear association, so it cannot be modeled by a linear function.

Answers: 1


Other questions on the subject: Mathematics
Mathematics, 21.06.2019 13:30, christeinberg1
Abbey purchased a house using a fixed rate mortgage. the annual interest rate is 4.2% compounded monthly for 20 years. the mortgage amount is $235,000. what is the monthly payment on the mortgage? this isn't a multiple choice question have to show my work
Answers: 1
Mathematics, 21.06.2019 17:00, alexandraschwartz21
Aswimming pool is a rectangle with semicircles on the end. the rectangle is 12 meters wide and 30 meters long. the diameter and width of the swimming pool are equal. sketch and label an overhead diagram of the swimming pool. find the area of the swimming pool floor.
Answers: 1
Mathematics, 21.06.2019 19:30, mariaaaaa69
Complete the solution of the equation. find the value of y when x equals to 28 x+3y=28
Answers: 2
Do you know the correct answer?
The scatter plot shows the relationship between the time t, in years after 1900, and the life expect...
Questions in other subjects:


Biology, 27.02.2020 16:52

Mathematics, 27.02.2020 16:52


