

Mathematics, 21.05.2020 00:03, pronces
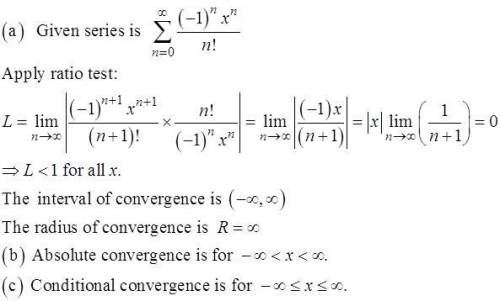
Consider the series Summation from n equals 0 to infinityStartFraction (negative 1 )Superscript n Baseline (x plus 1 )Superscript n Over n exclamation mark EndFraction . (a) Find the series' radius and interval of convergence. (b) For what values of x does the series converge absolutely? (c) For what values of x does the series converge conditionally? (a) Find the interval of convergence. nothing ▼ less than less than or equals x ▼ less than or equals less than nothing Find the radius of convergence. Requals nothing (b) For what values of x does the series converge absolutely? nothing ▼ less than less than or equals x ▼ less than less than or equals nothing (c) For what values of x does the series converge conditionally? Select the correct choice below and, if necessary, fill in the answer box to complete your choice. A. The series converges conditionally at xequals nothing. (Use a comma to separate answers as needed.) B. The series does not converge conditionally.

Answers: 2


Other questions on the subject: Mathematics
Mathematics, 21.06.2019 20:00, sahaitong2552
Write each of the following numerals in base 10. for base twelve, t and e represent the face values ten and eleven, respectively. 114 base 5 89t base 12
Answers: 1
Mathematics, 21.06.2019 20:30, jmcd10
Create a question with this scenario you could ask that could be answered only by graphing or using logarithm. david estimated he had about 20 fish in his pond. a year later, there were about 1.5 times as many fish. the year after that, the number of fish increased by a factor of 1.5 again. the number of fish is modeled by f(x)=20(1.5)^x.
Answers: 1
Mathematics, 21.06.2019 23:30, reycaden
The number of members f(x) in a local swimming club increased by 30% every year over a period of x years. the function below shows the relationship between f(x) and x: f(x) = 10(1.3)xwhich of the following graphs best represents the function? graph of f of x equals 1.3 multiplied by 10 to the power of x graph of exponential function going up from left to right in quadrant 1 through the point 0, 0 and continuing towards infinity graph of f of x equals 10 multiplied by 1.3 to the power of x graph of f of x equals 1.3 to the power of x
Answers: 1
Do you know the correct answer?
Consider the series Summation from n equals 0 to infinityStartFraction (negative 1 )Superscript n Ba...
Questions in other subjects:


Chemistry, 31.08.2020 14:01
Mathematics, 31.08.2020 14:01
Mathematics, 31.08.2020 14:01
Chemistry, 31.08.2020 14:01
Mathematics, 31.08.2020 14:01
Mathematics, 31.08.2020 14:01
Mathematics, 31.08.2020 14:01
Biology, 31.08.2020 14:01


