


Up to 100 points
Part A
Let’s work with some actual data this time. Go online to research...

Mathematics, 19.05.2020 14:08, larapoghosyan91
Up to 100 points
Part A
Let’s work with some actual data this time. Go online to research and find a set of real-world data in two variables. The data can be in tabular form or in a scatter plot. Choose data that has a reasonable number of data points so you’re able to uncover trends. For the purposes of this activity, the data must not show a linear association. Describe the data you’ve identified in a sentence or two, and include a link to the data.
Part B
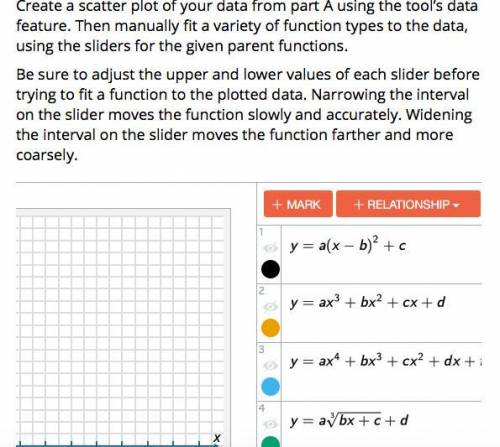
Create a scatter plot of your data from part A using the tool’s data feature. Then manually fit a variety of function types to the data, using the sliders for the given parent functions.
Be sure to adjust the upper and lower values of each slider before trying to fit a function to the plotted data. Narrowing the interval on the slider moves the function slowly and accurately. Widening the interval on the slider moves the function farther and more coarsely.
Part C
Identify the function from part B that best fits the scatter plot of your real-world data.
Part D
Why did you choose the function that you did in part C? Explain your answer.
Part E
Let’s say you had to make a prediction for the behavior of your data set that extends beyond the existing data points. Based on its end behavior, which type of function would best fit your scatter plot for long-term data projections? Do transformations play a role? Explain your reasoning.

Answers: 1
Other questions on the subject: Mathematics
Mathematics, 21.06.2019 20:00, nuclearfire278
Which of the following is an equation of a line parallel to the equation y=4x+1?
Answers: 1
Mathematics, 22.06.2019 04:30, shanekamayo1120
In which month was the peak, the largest deposit, made? january june july august
Answers: 1
Mathematics, 22.06.2019 04:30, elissadiaz15
The tiles on the left contain functions written using function notation . match each function with its input
Answers: 3
Do you know the correct answer?
Questions in other subjects:


Mathematics, 27.05.2020 21:59


