

Mathematics, 16.09.2019 09:00, ceceallen2003
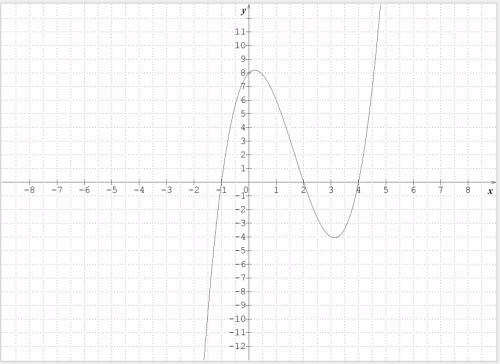
Which of the graphs below represent the function f(x) = x3 − 5x2 + 2x + 8? you may sketch the graph to compare. graph going through x axis at negative 2, positive 1, and 3. passes through y axis at 6. graph going through x axis at negative 1, positive 2, and 4. passes through y axis at 8. graph going through x axis at negative 2, positive 1, and 3. passes through y axis at negative 6. graph going through x axis near negative 2. passes through y axis at 8.

Answers: 1


Other questions on the subject: Mathematics
Mathematics, 21.06.2019 21:00, feyundre52
Hurry if the population of of an ant hill doubles every 10 days and there are currently 100 ants living in the ant hill what will the ant population be in 20 days
Answers: 2
Mathematics, 22.06.2019 00:30, alyssaanniebug
What is the slope of any line parallel to the line 8x+9y=3 in the standard (x, y) coordinate plane?
Answers: 1
Mathematics, 22.06.2019 00:40, sonyarucker
Can you divide 25 into 4 equal groups? explain why or why not.
Answers: 1
Do you know the correct answer?
Which of the graphs below represent the function f(x) = x3 − 5x2 + 2x + 8? you may sketch the graph...
Questions in other subjects:


Mathematics, 19.04.2020 23:30
Mathematics, 19.04.2020 23:30
Mathematics, 19.04.2020 23:30
Mathematics, 19.04.2020 23:30

Mathematics, 19.04.2020 23:30


