

Mathematics, 19.05.2020 03:25, spycn5069
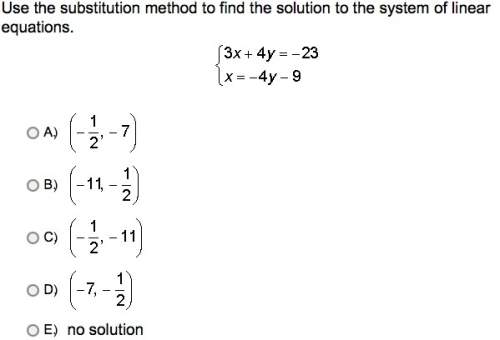
He students in Sam’s school voted for their favorite subject. Sam displayed the results in the cirlce graph shown.
Which statements are true about the data in the graph? Check all that apply.
A circle graph titled Favorite Subject. Math is 24 percent, language arts is 20 percent, science is 18 percent, social studies is 16 percent, art is 14 percent, and other is 8 percent.
If 100 students were surveyed, 34 would choose math as their favorite subject.
If 200 students were surveyed, 28 would choose art as their favorite subject.
If 400 students were surveyed, 64 would chose social studies as their favorite subject.
If 100 students were surveyed, 38 would choose science as their favorite subject.
If 200 students were surveyed, more than half would choose science or social studies as their favorite subject.

Answers: 3


Other questions on the subject: Mathematics
Mathematics, 21.06.2019 17:30, kruzyoungblood8
When a rectangle is dilated, how do the perimeter and area of the rectangle change?
Answers: 2
Mathematics, 21.06.2019 20:00, stichgotrich7159
Michael is training for a marathon. in his first week he plans to run 8miles. what path should he take
Answers: 1
Mathematics, 21.06.2019 20:00, Queenashley3232
Combine like terms to make a simpler expression 3z+z
Answers: 2
Mathematics, 21.06.2019 22:20, abbygriffin8575
Which graph has figures that can undergo a similarity transformation to justify that they are similar? (obviously not the third one)
Answers: 2
Do you know the correct answer?
He students in Sam’s school voted for their favorite subject. Sam displayed the results in the cirlc...
Questions in other subjects:


