


Compare the graphs below of the logarithmic functions. Write the equation to represent g(x)
...

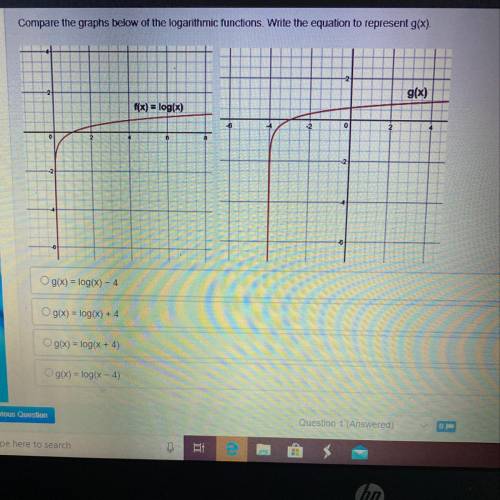
Mathematics, 19.05.2020 02:22, lenna23
Compare the graphs below of the logarithmic functions. Write the equation to represent g(x)

Answers: 3
Other questions on the subject: Mathematics
Mathematics, 21.06.2019 16:00, kell22wolf
Part one: measurements 1. measure your own height and arm span (from finger-tip to finger-tip) in inches. you will likely need some from a parent, guardian, or sibling to get accurate measurements. record your measurements on the "data record" document. use the "data record" to you complete part two of this project. name relationship to student x height in inches y arm span in inches archie dad 72 72 ginelle mom 65 66 sarah sister 64 65 meleah sister 66 3/4 67 rachel sister 53 1/2 53 emily auntie 66 1/2 66 hannah myself 66 1/2 69 part two: representation of data with plots 1. using graphing software of your choice, create a scatter plot of your data. predict the line of best fit, and sketch it on your graph. part three: the line of best fit include your scatter plot and the answers to the following questions in your word processing document 1. 1. which variable did you plot on the x-axis, and which variable did you plot on the y-axis? explain why you assigned the variables in that way. 2. write the equation of the line of best fit using the slope-intercept formula $y = mx + b$. show all your work, including the points used to determine the slope and how the equation was determined. 3. what does the slope of the line represent within the context of your graph? what does the y-intercept represent? 5. use the line of best fit to you to describe the data correlation.
Answers: 2
Mathematics, 21.06.2019 16:00, dayanawhite64
Which term best describes the association between variables a and b? no association a negative linear association a positive linear association a nonlinear association a scatterplot with an x axis labeled, variable a from zero to ten in increments of two and the y axis labeled, variable b from zero to one hundred forty in increments of twenty with fifteen points in a positive trend.
Answers: 2
Mathematics, 21.06.2019 21:30, ajm1132005
Questions 9-10. use the table of educational expenditures to answer the questions. k-12 education expenditures population indiana $9.97 billion 6.6 million illinois $28.54 billion 12.9 million kentucky $6.58 billion 4.4 million michigan $16.85 billion 9.9 million ohio $20.23 billion 11.6million 9. if the amount of k-12 education expenses in indiana were proportional to those in ohio, what would have been the expected value of k-12 expenditures in indiana? (give the answer in billions rounded to the nearest hundredth) 10. use the value of k-12 education expenditures in michigan as a proportion of the population in michigan to estimate what the value of k-12 education expenses would be in illinois. a) find the expected value of k-12 expenditures in illinois if illinois were proportional to michigan. (give the answer in billions rounded to the nearest hundredth) b) how does this compare to the actual value for k-12 expenditures in illinois? (lower, higher, same? )
Answers: 1
Do you know the correct answer?
Questions in other subjects:


Biology, 06.01.2021 20:00
English, 06.01.2021 20:00

Social Studies, 06.01.2021 20:00
Mathematics, 06.01.2021 20:00
Biology, 06.01.2021 20:00
Mathematics, 06.01.2021 20:00

Arts, 06.01.2021 20:00


