


Bakery A Bakery B

Mathematics, 15.05.2020 08:57, davia97
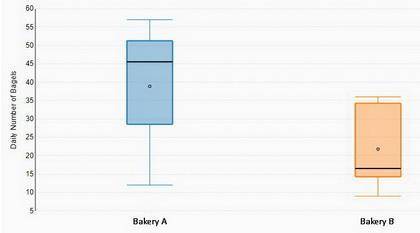
The number of bagels sold daily for two bakeries is shown in the table:
Bakery A Bakery B
15 15
52 16
51 34
33 35
57 12
12 9
45 36
46 17
Based on these data, is it better to describe the centers of distribution in terms of the mean or the median? Explain.
A.) Mean for both bakeries because the data is symmetric
B.) Mean for Bakery B because the data is symmetric; median for bakery A because the data is not symmetric
C.) Mean for Bakery A because the data is symmetric; median for Bakery B because the data is not symmetric
D.) Median for both bakeries because the data is not symmetric

Answers: 2
Other questions on the subject: Mathematics
Mathematics, 21.06.2019 19:00, PastelHibiscus
Which equation represents the function on the graph?
Answers: 1
Mathematics, 21.06.2019 20:00, anabelleacunamu
Find the value of x. round the length to the nearest tenth
Answers: 1
Do you know the correct answer?
The number of bagels sold daily for two bakeries is shown in the table:
Bakery A Bakery B
Bakery A Bakery B
Questions in other subjects:


Medicine, 07.12.2021 22:50

Physics, 07.12.2021 22:50
Mathematics, 07.12.2021 22:50

Chemistry, 07.12.2021 23:00

SAT, 07.12.2021 23:00

Social Studies, 07.12.2021 23:00


