
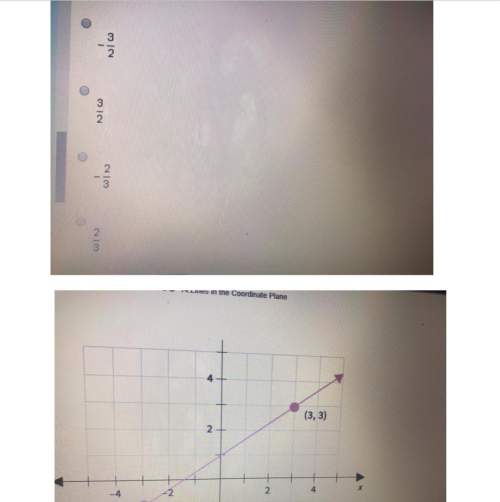


The graph of f(x) = 2x is shown on the grid.
The graph of g(x) = (3) is the graph of f(x) = 2*...

Mathematics, 07.05.2020 07:59, brenda2512
The graph of f(x) = 2x is shown on the grid.
The graph of g(x) = (3) is the graph of f(x) = 2* reflected
over the y-axis. Which graph represents g(x)?
+
HALL
-5
-4
-3
Mark this and return
Save and Exit
Next
Submit

Answers: 1
Other questions on the subject: Mathematics
Mathematics, 21.06.2019 13:50, webbhlharryteach
What is the value of x in the equation 6(x + 1) – 5x = 8 + 2(x – 1)?
Answers: 1
Mathematics, 21.06.2019 14:30, bryce12351
An eight-sided die, which may or may not be a fair die, has four colors on it; you have been tossing the die for an hour and have recorded the color rolled for each toss. what is the probability you will roll a brown on your next toss of the die? express your answer as a simplified fraction or a decimal rounded to four decimal places.
Answers: 2
Do you know the correct answer?
Questions in other subjects:

History, 19.05.2020 16:09

Law, 19.05.2020 16:09
Mathematics, 19.05.2020 16:10
Mathematics, 19.05.2020 16:10

English, 19.05.2020 16:10


