
 = 1 decade
 decades

2.3 THINK: Florida Part 2
77
In 1840, the population of Florida was about 54,500. Betwee...

Mathematics, 07.05.2020 07:05, Zykuko
2.3 THINK: Florida Part 2
77
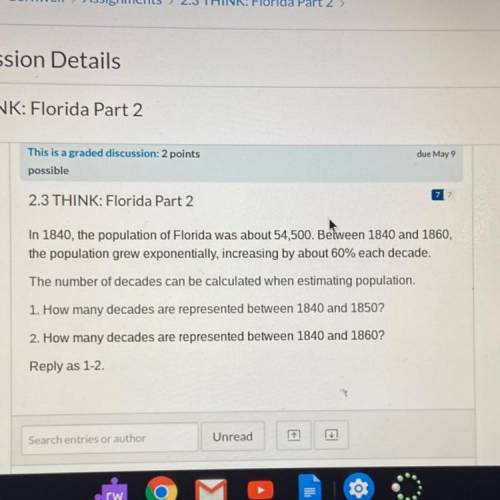
In 1840, the population of Florida was about 54,500. Between 1840 and 1860,
the population grew exponentially, increasing by about 60% each decade.
The number of decades can be calculated when estimating population.
1. How many decades are represented between 1840 and 1850?
2. How many decades are represented between 1840 and 1860?
Reply as 1-2

Answers: 1
Other questions on the subject: Mathematics
Mathematics, 21.06.2019 21:00, batmanmarie2004
The functions below show the amount of money bella and sweet t had saved after earning money for doing chores. which description best compares the two functions?
Answers: 1
Mathematics, 22.06.2019 02:30, homeschool0123
Solve the compound inequality. graph your solution. 2x – 2 < –12 or 2x + 3 > 7 x < –5 or x > 5 x < –5 or x > 2 x < –12 or x > 2 x < –7 or x > 5
Answers: 2
Do you know the correct answer?
Questions in other subjects:
Mathematics, 07.12.2020 23:50


Biology, 07.12.2020 23:50
Mathematics, 07.12.2020 23:50


