


.
hi
Complete the Histogram Table.
HHH
DU
Consider the set {3, 11, 12, 19,...

Mathematics, 07.05.2020 04:09, aidenbender06
.
hi
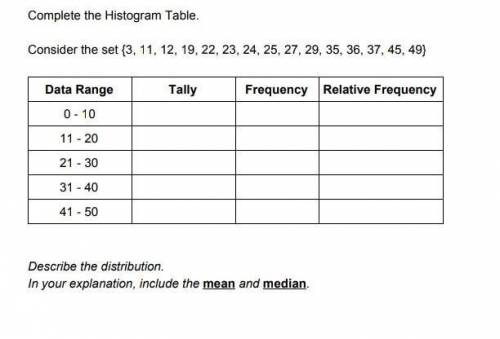
Complete the Histogram Table.
HHH
DU
Consider the set {3, 11, 12, 19, 22, 23, 24, 25, 27, 29, 35, 36, 37, 45, 49}
e
SEST
Data Range
FM
Tally
Frequency
Relative
Frequency
TGT
0 - 10
11 - 20
21 - 30
31 - 40
LLL
w
1
1
1
.
INCIN
41 - 50
TA
Describe the distribution.
In your explanation, include the mean and median.
nean
edia

Answers: 3
Other questions on the subject: Mathematics
Mathematics, 21.06.2019 20:00, hayleylaw2018
Which fraction is equal to 1hole and 2/5? a.3/5 b.75 c.57 d.73
Answers: 2
Mathematics, 21.06.2019 21:10, lizbeth696
The vertices of a triangle are a(7.5), b(4,2), and c19. 2). what is
Answers: 1
Mathematics, 21.06.2019 22:00, stricklandashley43
1. how do you convert the repeating, nonterminating decimal 0. to a fraction? explain the process as you solve the problem.
Answers: 2
Do you know the correct answer?
Questions in other subjects:

Mathematics, 31.07.2019 16:30

English, 31.07.2019 16:30


