


Which of the following is true of the data represented by the box plot?
box plot with po...

Mathematics, 06.05.2020 02:38, hall7948
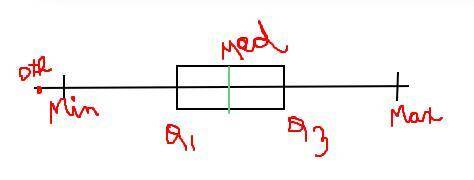
Which of the following is true of the data represented by the box plot?
box plot with point at 15, min at 17, Q1 at 51, median at 65, Q3 at 74, max at 90
A) If the outlier is included in the data, the median would not significantly change.
B) If the outlier is included in the data, the mean would increase.
C) If the outlier is included in the data, the box plot would be significantly skewed.
D) If the outlier is included in the data, the length of the tails would change significantly.

Answers: 1
Other questions on the subject: Mathematics
Mathematics, 21.06.2019 20:00, allycoops666666
Sarah took the advertising department from her company on a round trip to meet with a potential client. including sarah a total of 11 people took the trip. she was able to purchase coach tickets for $280 and first class tickets for $1280. she used her total budget for airfare for the trip, which was $6080. how many first class tickets did she buy? how many coach tickets did she buy?
Answers: 1
Do you know the correct answer?
Questions in other subjects:
Mathematics, 05.11.2019 04:31

Social Studies, 05.11.2019 04:31

Mathematics, 05.11.2019 04:31

World Languages, 05.11.2019 04:31
Mathematics, 05.11.2019 04:31
Mathematics, 05.11.2019 04:31


