

Mathematics, 06.05.2020 00:42, Yailynn565
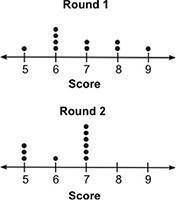
The dot plots below show the scores for a group of students who took two rounds of a quiz:
Two dot plots are shown one below the other. The title for the dot plot on the top is Round 1 and the title for the bottom plot is Round 2. Below the line for each dot plot is written Score. There are markings from 5 to 9 on the line at intervals of one. There is 1 dot above the mark 5, 4 dots above the mark 6, 2 dots above the mark 7, 2 dots above mark 8, and 1 dot above the mark 9. For the bottom dot plot there are 3 dots above the mark 5, 1 dot above the mark 6, and 6 dots above the mark 7.
Which of the following inferences can be made using the dot plot?
A. There is no overlap between the data.
B. Round 1 scores were lower than round 2 scores.
C. Round 2 scores were higher than round 1 scores.
D. The range of round 1 is greater than the round 2 range.

Answers: 2


Other questions on the subject: Mathematics
Mathematics, 22.06.2019 02:20, Amholloway13
Jenny invests $2,000 at an interest rate of 5%. the amount of money, me, in jenny's account after tyears can be represented using the equation ma-2000(1.05). if jenny would have invested the same amount of money at the same interest rate four years ago, the equation representing the amount of money mo. in her account would be represented using the equation! mg = 2000(105)*** which of the following is equivalent to mp? 2000(105) om- 1.05 2000(1.05) mo 1059 mp-2000(1.05) (105) mp - 2000(1.05) + (1.05)
Answers: 1
Mathematics, 22.06.2019 02:30, loveeegabbie7071
An incoming airplane is x miles due north from the control tower at an airport. a second incoming airplane is y miles due east of the same control tower. the shortest distance between the two airplanes is z miles. which of the following functions would best model the situation above?
Answers: 1
Do you know the correct answer?
The dot plots below show the scores for a group of students who took two rounds of a quiz:
Questions in other subjects:


English, 09.11.2020 05:40


