


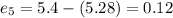
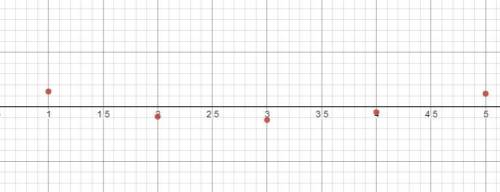


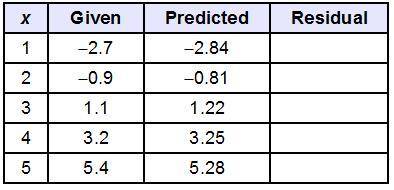
Find the residual values, and use the graphing calculator tool to make a residual plot.
...

Mathematics, 05.05.2020 09:49, okitsfrizz6366
Find the residual values, and use the graphing calculator tool to make a residual plot.
Does the residual plot show that the line of best fit is appropriate for the data?
No, the points are in a curved pattern.
No, the points are evenly distributed about the x-axis.
Yes, the points are in a linear pattern.
Yes, the points have no pattern.

Answers: 2
Other questions on the subject: Mathematics
Mathematics, 21.06.2019 18:30, guillianaroberts
Water flows at a steady rate from a tap. its takes 40 seconds to fill a 4 litre watering can from the tap. the rate at which water flows from the tap is halved. complete: 4 litres into cm3
Answers: 3
Mathematics, 22.06.2019 01:00, imamnaab5710
3questions show how you solved the problem 1. subtract & simplify (–y2 – 4y – 8) – (–4y2 – 6y + 3) 2.multiply and simplify 2x2y3z2 · 4xy4x2 3.multiply and simplify (x – 4) (x2 – 5x – 6)
Answers: 1
Do you know the correct answer?
Questions in other subjects:

French, 23.04.2021 01:10

Computers and Technology, 23.04.2021 01:10

Mathematics, 23.04.2021 01:10
Mathematics, 23.04.2021 01:10

Mathematics, 23.04.2021 01:10


