


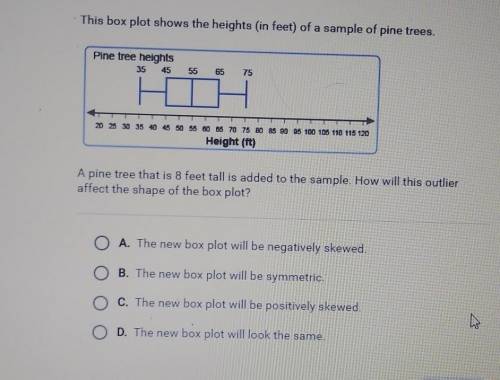
This box plot shows the heights (in feet) of a sample of pine trees.
Pine tree heights
35...

Mathematics, 05.05.2020 05:55, marianabeel230
This box plot shows the heights (in feet) of a sample of pine trees.
Pine tree heights
35 45
55
65
75
230 35 40 25 30
75 80 85 80 85 100 105
20
150
25 30 35 40 45 50 55 60 65 70 75 80 85 90 95 100 105 110 115 120
Height (ft)
A pine tree that is 8 feet tall is added to the sample. How will this outlier
affect the shape of the box plot?

Answers: 2
Other questions on the subject: Mathematics
Mathematics, 21.06.2019 19:40, joexx159
The human resources manager at a company records the length, in hours, of one shift at work, x. he creates the probability distribution below. what is the probability that a worker chosen at random works at least 8 hours? probability distribution px(x) 6 hours 7 hours 8 hours 9 hours 10 hours 0.62 0.78 пол
Answers: 1
Mathematics, 21.06.2019 20:30, cogger9348
3.17 scores on stats final. below are final exam scores of 20 introductory statistics students. 1 2 3 4 5 6 7 8 9 10 11 12 13 14 15 16 17 18 19 20 57, 66, 69, 71, 72, 73, 74, 77, 78, 78, 79, 79, 81, 81, 82, 83, 83, 88, 89, 94 (a) the mean score is 77.7 points. with a standard deviation of 8.44 points. use this information to determine if the scores approximately follow the 68-95-99.7% rule. (b) do these data appear to follow a normal distribution? explain your reasoning using the graphs provided below.
Answers: 1
Do you know the correct answer?
Questions in other subjects:


Mathematics, 06.06.2021 03:00


