


These box plots show daily low temperatures for a sample of days in two
different towns.
T...

Mathematics, 05.05.2020 05:54, keke6361
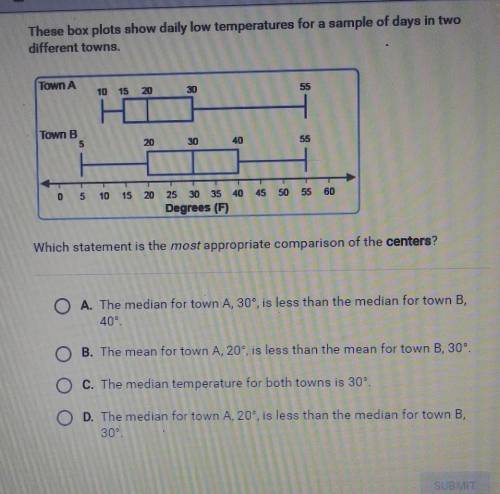
These box plots show daily low temperatures for a sample of days in two
different towns.
TOWN A
10
15
20
30
Town B
2030
411
0
5
10
15
20
45 50 55 60
25 30 35 40
Degrees (F)
Which statement is the most appropriate comparison of the centers?

Answers: 3
Other questions on the subject: Mathematics
Mathematics, 21.06.2019 18:50, millernicholas622
The random variable x represents the number of phone calls an author receives in a day, and it has a poisson distribution with a mean of 8.7 calls. what are the possible values of x
Answers: 1
Mathematics, 21.06.2019 19:00, SakChan8367
Ab based on the given diagram, if m_1 = 60° then m 2 = 30 60 90 180
Answers: 1
Do you know the correct answer?
Questions in other subjects:
Mathematics, 19.02.2021 01:00

Physics, 19.02.2021 01:00

English, 19.02.2021 01:00


Spanish, 19.02.2021 01:00
Mathematics, 19.02.2021 01:00


Mathematics, 19.02.2021 01:00
Mathematics, 19.02.2021 01:00


