

Mathematics, 05.05.2020 04:56, mimi5937
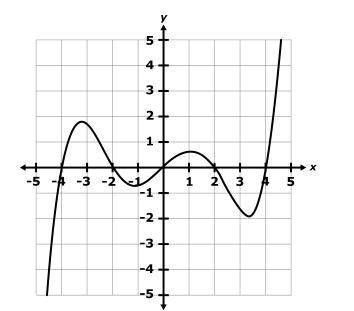
Which of the following functions have the same end behavior as the graph shown? Select two that apply.
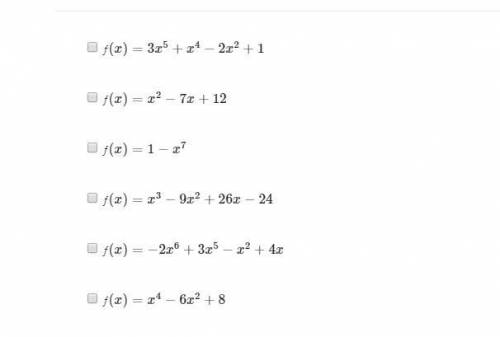
ƒ(x)=3x^5+x^4−2x^2+1
ƒ(x)=x^2−7x+12
ƒ(x)=1−x^7
ƒ(x)=x^3−9x^2+26x−24
ƒ(x)=−2x^6+3x^5−x^2+4x
ƒ(x)=x4−6x^2+8

Answers: 1


Other questions on the subject: Mathematics
Mathematics, 21.06.2019 23:30, pradojosselinep34b1k
Find the directions in which the function increases and decreases most rapidly at upper p 0p0. then find the derivatives of the function in these directions. f(x, y)equals=x squared plus xy plus y squaredx2+xy+y2, upper p 0p0left parenthesis 1 comma negative 4 right parenthesis
Answers: 2
Mathematics, 22.06.2019 02:10, genyjoannerubiera
The key on a road map has a scale factor of 1.5 inches = 50 miles. the distance between santa fe and albuquerque measures 7.5 inches. the distance between santa fe and taos is 0.75 inches. what is the actual distance between the cities?
Answers: 3
Mathematics, 22.06.2019 02:30, Leii691
According to a research study, parents with young children slept 6.4 hours each night last year, on average. a random sample of 18 parents with young children was surveyed and the mean amount of time per night each parent slept was 6.8. this data has a sample standard deviation of 0.9. (assume that the scores are normally distributed.) researchers conduct a one-mean hypothesis at the 5% significance level, to test if the mean amount of time parents with young children sleep per night is greater than the mean amount of time last year. the null and alternative hypotheses are h0: μ=6.4 and ha: μ> 6.4, which is a right-tailed test. the test statistic is determined to be t0=1.89 using the partial t-table below, determine the critical value(s). if there is only one critical value, leave the second answer box blank.
Answers: 3
Do you know the correct answer?
Which of the following functions have the same end behavior as the graph shown? Select two that appl...
Questions in other subjects:


Spanish, 26.05.2021 21:40


SAT, 26.05.2021 21:40
Mathematics, 26.05.2021 21:40
Mathematics, 26.05.2021 21:40


Chemistry, 26.05.2021 21:40


