


HURRY ILL MARK YOU THE BRAINLEST
The box plots below show the average daily temperatures in J...

Mathematics, 03.05.2020 13:57, jbearden
HURRY ILL MARK YOU THE BRAINLEST
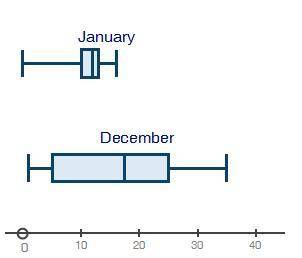
The box plots below show the average daily temperatures in January and December for a U. S. city:
two box plots shown. The top one is labeled January. Minimum at 0, Q1 at 10, median at 12, Q3 at 13, maximum at 16. The bottom box plot is labeled December. Minimum at 1, Q1 at 5, median at 18, Q3 at 25, maximum at 35
What can you tell about the means for these two months? (1 point)
Group of answer choices
The mean for December is higher than January's mean.
It is almost certain that January's mean is higher.
There is no way of telling what the means are.
The narrow IQR for January causes its mean to be lower.

Answers: 3
Other questions on the subject: Mathematics
Mathematics, 21.06.2019 17:00, cjd1214812148
The rectangle on the right is the image of the rectangle on the left. what transformation would result in this image? reflection rotation translation dilation
Answers: 2
Do you know the correct answer?
Questions in other subjects:


Mathematics, 02.04.2021 01:00


Social Studies, 02.04.2021 01:00
Mathematics, 02.04.2021 01:00


