
 = ± 12

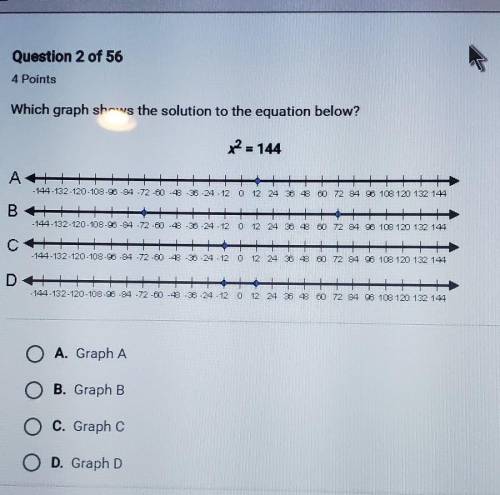
Which graph shows the solution to the equation below?
x = 144
...

Mathematics, 03.05.2020 13:36, lizzyhearts
Which graph shows the solution to the equation below?
x = 144

Answers: 1
Other questions on the subject: Mathematics
Mathematics, 21.06.2019 14:50, gshreya2005
(a) compute the maclaurin polynomial m2(x) for f(x) = cos x. (b) use the polynomial of part (a) to estimate cos π 12. (c) use a calculator to compute the error made using the estimate from part (b) for the value of cos π 12. remember that the error is defined to be the absolute value of the difference between the true value and the estimate.
Answers: 2
Mathematics, 21.06.2019 23:00, Hannahrose911
Someone answer this asap for gabriella uses the current exchange rate to write the function, h(x), where x is the number of u. s. dollars and h(x) is the number of euros, the european union currency. she checks the rate and finds that h(100) = 7.5. which statement best describes what h(100) = 75 signifies? a. gabriella averages 7.5 u. s. dollars for every 100 euros. b. gabriella averages 100 u. s. dollars for every 25 euros. c. gabriella can exchange 75 u. s. dollars for 100 euros. d. gabriella can exchange 100 u. s. dollars for 75 euros.
Answers: 1
Mathematics, 22.06.2019 01:30, aprilreneeclaroxob0c
The winner of a golf tournament made five putts for birdies. the lengths of these putts are in the table shown. what is the total distance of the putts in the yards, feet, and inches?
Answers: 1
Do you know the correct answer?
Questions in other subjects:

Mathematics, 01.11.2019 02:31

History, 01.11.2019 02:31

English, 01.11.2019 02:31
History, 01.11.2019 02:31


