


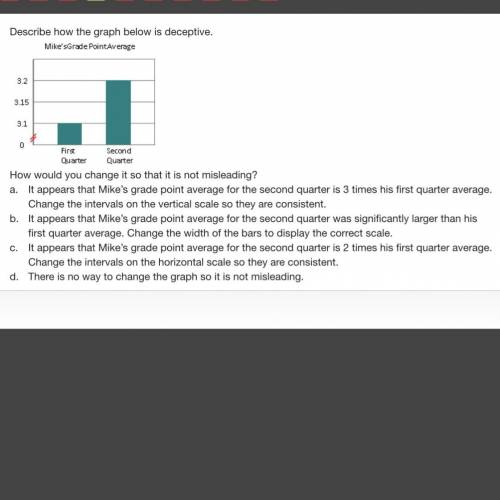
Describe how the graph below is deceptive.
How would you change it so that it is not mi...

Mathematics, 05.05.2020 00:18, austintules2005
Describe how the graph below is deceptive.
How would you change it so that it is not misleading?
a.
It appears that Mike’s grade point average for the second quarter is 3 times his first quarter average. Change the intervals on the vertical scale so they are consistent.
b.
It appears that Mike’s grade point average for the second quarter was significantly larger than his first quarter average. Change the width of the bars to display the correct scale.
c.
It appears that Mike’s grade point average for the second quarter is 2 times his first quarter average. Change the intervals on the horizontal scale so they are consistent.
d.
There is no way to change the graph so it is not misleading.

Answers: 2
Other questions on the subject: Mathematics
Mathematics, 21.06.2019 19:30, keidyhernandezm
James was playing a game with his friends. he won 35 points. then he lost 15, lost 40 and won 55. how did he come out
Answers: 2
Do you know the correct answer?
Questions in other subjects:


Engineering, 13.05.2021 01:00
Mathematics, 13.05.2021 01:00


