

Mathematics, 05.05.2020 16:00, unii
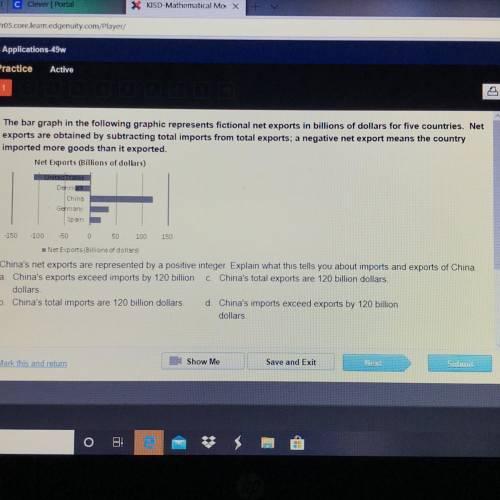
The bar graph in the following graphic represents fictional net exports in billions of dollars for five countries. Net
exports are obtained by subtracting total imports from total exports, a negative net export means the country
imported more goods than it exported.
Net Exports (Billions of dollars)
United States
Denmark
China
• Germany
Spain
-150 100 50 0 50 100 150
Net Exports (Billions of dollars
China's net exports are represented by a positive integer. Explain what this tells you about imports and exports of China
a China's exports exceed imports by 120 billion c. China's total exports are 120 billion dollars.
dollars.
b. China's total imports are 120 billion dollars. d. China's imports exceed exports by 120 billion
dollars

Answers: 2


Other questions on the subject: Mathematics
Mathematics, 21.06.2019 17:00, Niyah3406
When you are making a circle graph by hand, how do you convert a number for a part into its corresponding angle measure in the circle graph? when you are making a circle graph by hand, what should you do if one of your angle measures is greater than 180°?
Answers: 2
Mathematics, 21.06.2019 21:30, ladydeathanddea
Amira is painting a rectangular banner 2 1/4 yards wide. the banner will have a blue background. amira has enough paint to cover 1 1/2 square yards of the wall. the school colors are blue and yellow, so amira wants to add yellow rectangles on the left and right sides of the blue rectangle. the yellow rectangles will each be 3/4 yards wide and the same height as the blue rectangle. what will be the total area of the two yellow rectangles?
Answers: 3
Mathematics, 22.06.2019 00:20, destinyd10189
Ze trinomial x2 + bx – c has factors of (x + m)(x – n), where m, n, and b are positive. what is ze relationship between the values of m and n? explain how you got ze answer
Answers: 2
Do you know the correct answer?
The bar graph in the following graphic represents fictional net exports in billions of dollars for f...
Questions in other subjects:
Mathematics, 01.12.2020 03:00

History, 01.12.2020 03:00
Mathematics, 01.12.2020 03:00


